
What's inside?
To create our Industry Report, we analysed 3,000 keywords in the Consumer Electronics Industry. The keywords researched were split into 6 different categories:
- TV & Audio
- SmartTech
- Phones
- Gaming
- Computers
- Appliances
How are users searching for consumer products?
Within the Consumer Electronics Industry, 68% of searches are on mobile, while just 31.9% are on desktop. Mobile search has definitely taken over desktop search, especially within the Phones, Appliances and TV and Audio keyword groups.
There is a lot of competition to rank high and stand out on mobile as 91.4% of position 1 organic rankings appear below the fold with Google dominating these six categories. Google owns the majority market share for all categories except for Gaming where their YouTube company has the biggest share.
Within our study, we found that there are only 32% of searches on desktop, and only 36.7% of 1st organic rankings below the fold on desktop, compared to 91.4% of position 1 organic rankings appearing below the fold on mobile. It therefore appears to be easier to rank higher organically on desktop.
Our recommendations for marketers are to ensure they optimise their site to load quickly on mobile and to review what featured snippets give them the highest possibility of standing out against competitors.
SERP Breakdown
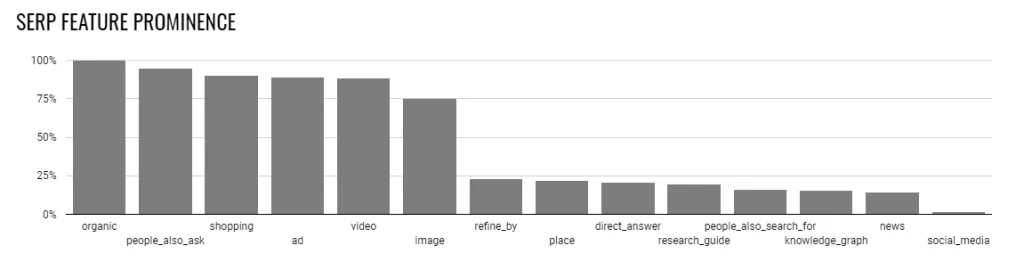
People Also Ask (PAA)
The report shows that People Also Ask (aside from organic results) are, at the moment, the most prominent SERP result type in the Consumer Electronics Industry.
The percentage of People Also Ask (PAA) result types dropped by 1.4% (from 96.7% to 95.3%) whereas Ads saw an increase of 4.7% (from 88.7% to 93.4%) between October and November 2019. This may be due to the increase in Ad spend in the lead up to Black Friday and Christmas.
Interestingly, this looked like Google was ensuring that paid ads were, aside from organic, the key result type. However, after further analysing the data, it can be inferred that Google is trying to find the best fit of result types as the prominence of different key features change month on month, without a clear push towards ads.
The percentage of keywords that generate PAA results in the Travel Industry is 78.3%, this is far lower than we saw in the Consumer Electronics Industry at 95.3%. This may be due to the different user intent, consumers may be asking more questions around purchasing technology, therefore marketers in this industry should ensure their content is informational, to answer the questions of these users.
Video
In our study, we found video SERPs appeared for 88% of keywords on mobile and just 24% on desktop. Therefore, video content seems to be consumed the most on mobile, especially in the SmartTech category (92.7% of keywords display videos on mobile, and 33.9% on desktop). This figure is the lowest in the Phone category at 79%.
Therefore, in the SmartTech category it may be key for companies to have influencers, or their own YouTube channel in order to higher rank in these results.
Images
Similar to the video SERPs, we see a higher percentage of keywords generating image SERPs on mobile, with an average of 22.2% on desktop, and 71.3% on mobile. This is a huge difference and is important for optimising your website, ensuring the images are quick to load and mobile friendly.
- The Appliances category sees up to 31% of keywords featuring an image.
- This drops to just 18% for the SmartTech category.
Places
- The Computers category generated the highest percentage of Places results for desktop at 25%.
- This was significantly higher than mobile, which was almost half, with 12% of keywords in this category returning Places results.
- As we saw with the Travel Industry Report, Google Places prominence varies considerably across devices with half the penetration in SmartTech compared to TV and Audio and Computers.
- It was 5% for SmartTech on mobile, the lowest across the 6 categories.
After further investigation and looking at current Places results, we found that Google seems to display Place results based on search queries and location tracking. In the example on the right, we searched for ‘Samsung Washing Machine’ while in Twickenham. In the results we found Google seemed to use our search query to display nearby retailers the Places results, as seen in the screenshot.
This suggests that consumers like to go in store in this industry, and demonstrates the importance of brick and mortar companies having well optimised Google My Business listing to encourage footfall.

Conclusion
Due to the high percentage of keywords generating PAA results, it is obvious that content creation is key in this industry. It would also seem that visual content, such as videos and images are more prominent and consumed more readily on mobile, compared to on desktop.
Our findings are reinforced by Google, as their research states that users consuming content for research purposes is a key part of the buying process in this industry.
Naturally, we are only scratching the surface with the insights you can gain from this report, so really you need to download the report yourself and find out more!
The data was last updated in June 2020. If you are interested in a more up-to-date version of this report for the travel industry or any industry for that matter, then please get in touch.