


We've just added a few more exciting reports to our standard SEO Data Studio reports.
Visit our features page, for more information on what you can with the Authoritas platform in terms of SEO reporting.
N/B: To use these reports you need to have platform access with Google Big Query integration.
You can easily view and copy this report.
Here's a quick summary of the two new report pages we've added
SEO Visibility by Tag
Under the SEO Visibility menu there is a new page called 'SEO Visibility by Tag'.

This report uses an advanced view in Big Query which we automatically send to all the platform projects that you sync to Big Query.It allows you to see the SEO Visibility for your domain and your competitors over time. You can also further breakdown the analysis to specific groups of keywords using keyword tags.
By default the table summarises your SEO performance and the change in performance over the past 1 week, 4 weeks, 13 weeks, 26 weeks and 52 weeks.By clicking on an individual tag group you can see similar performance changes for every keyword. This is a great way to see where you or your competitors are winning or losing, and to drill into the root causes of why this is happening.

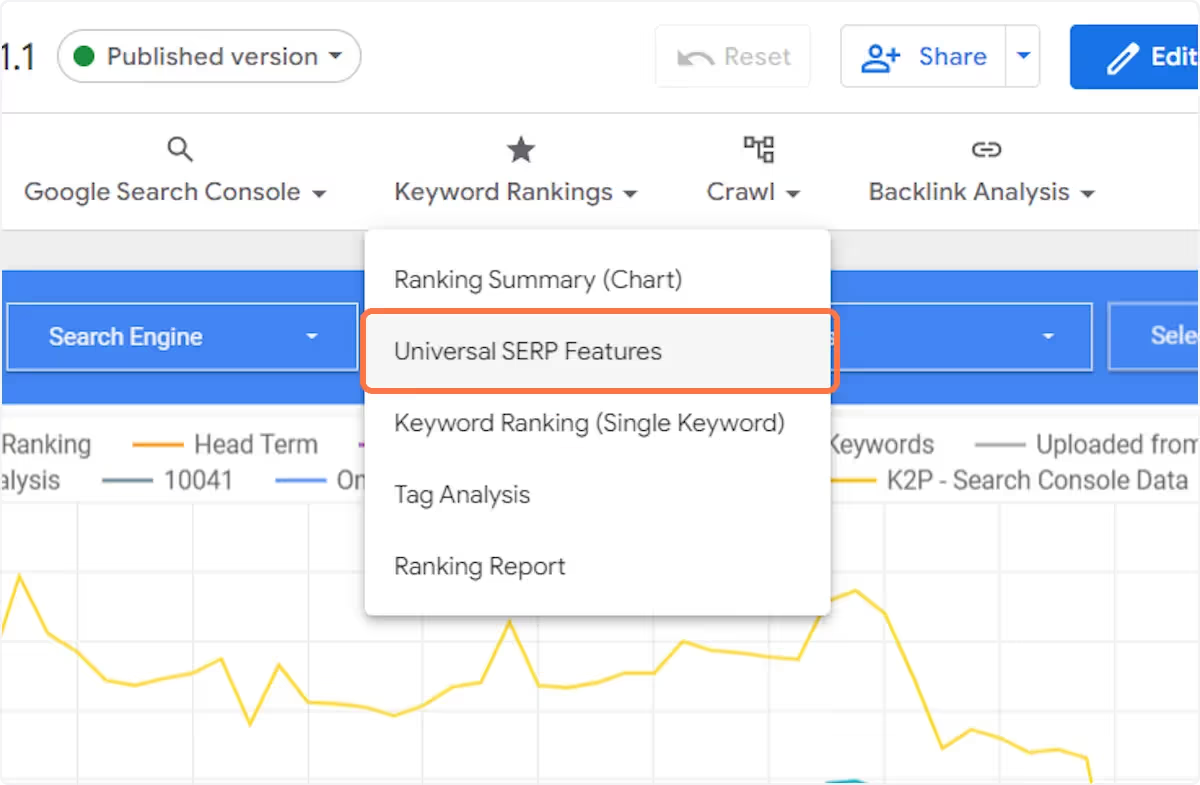
Universal Features
The next new feature is under the Keyword Rankings menu. It is a new report called 'Universal Features' which reports on you and your competitors' performance in winning key SERP features.
You can see all your ranking keywords and search engines and a chart showing you how many SERP features there are for the keywords you are monitoring (please note, one keyword typically generates many different SERP feature types and we track ~40 or so).
We recommend selecting only one ranking engine at a time to make it easy for you to analyse the data.
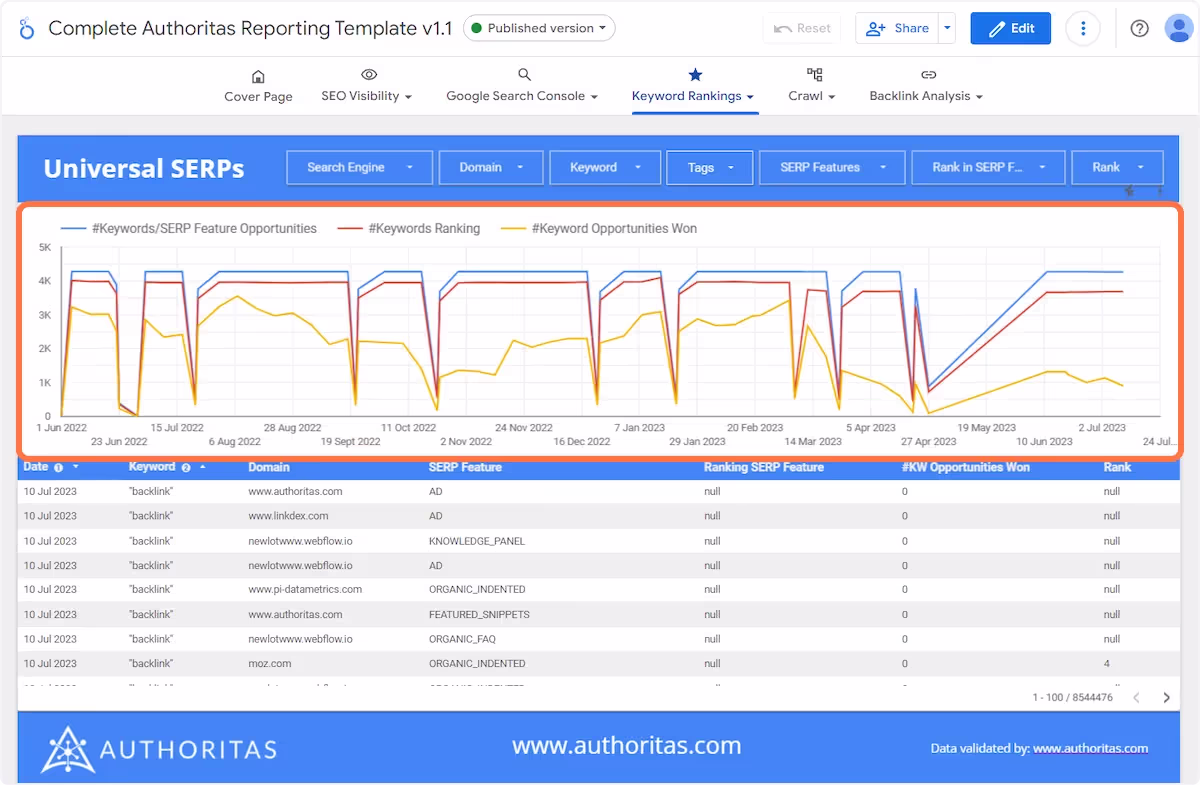
There are three series on the chart:
The first shows you how many SERP features there are for your keywords.
The second shows you how many of these you actually have a keyword ranking for (meaning you can probably target this feature).
The third series shows you how many of these SERP features you have won. We call this '#KW Opportunities Won' in the table below.
You can see in the table that there are multiple entries for each keyword on each date, as each keyword generates multiple SERP features and each has its own row. This means you can use the 'SERP Features' filters to drill down to a specific SERP feature and the 'Rank in SERP Features' filter to see if you actually rank for a specific SERP feature or not.
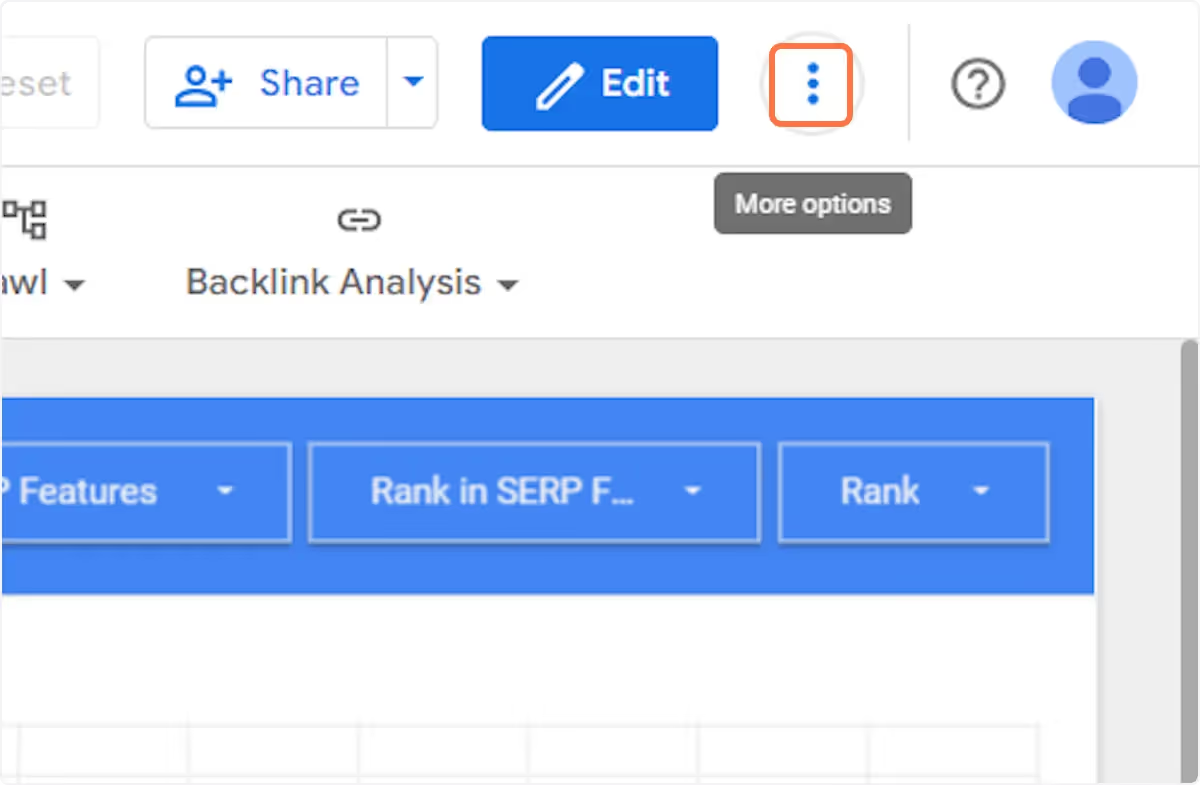
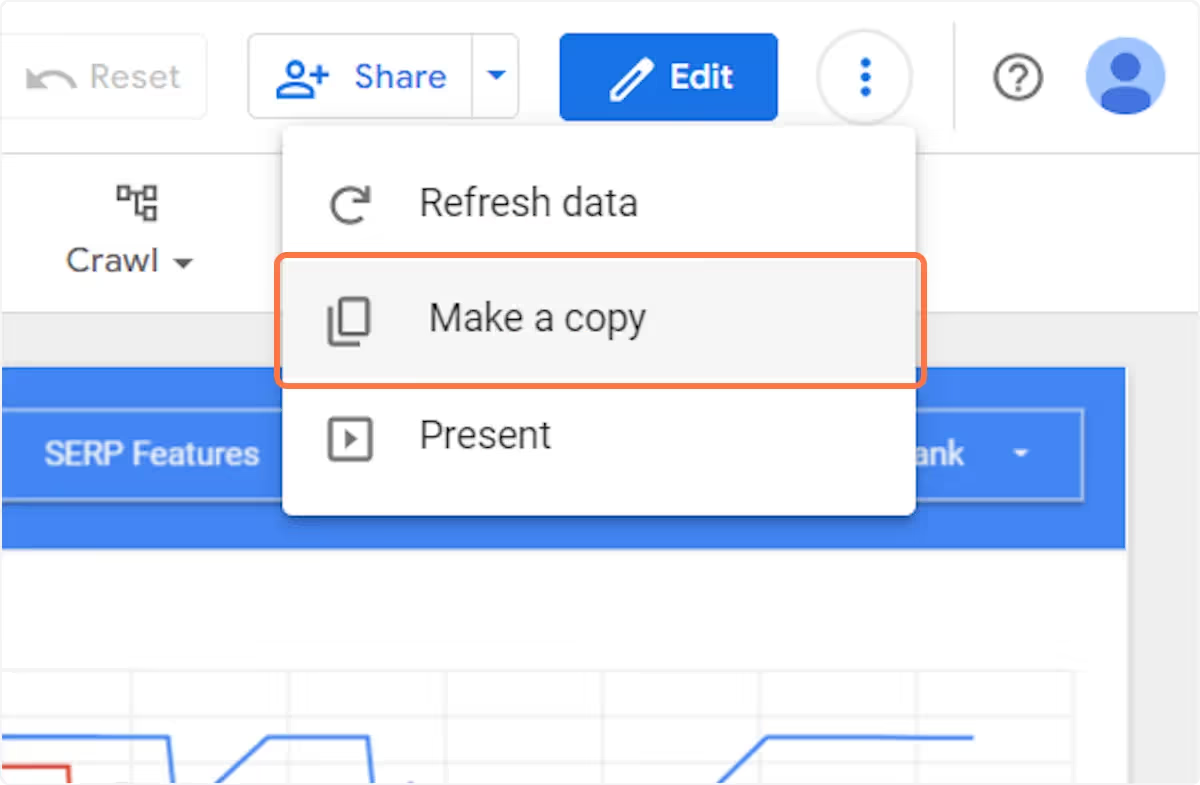
That summarises the 2 new key updates. If you want to use the report, it's very easy to do, simply click on the 3 dot menu and select 'Make a copy'.
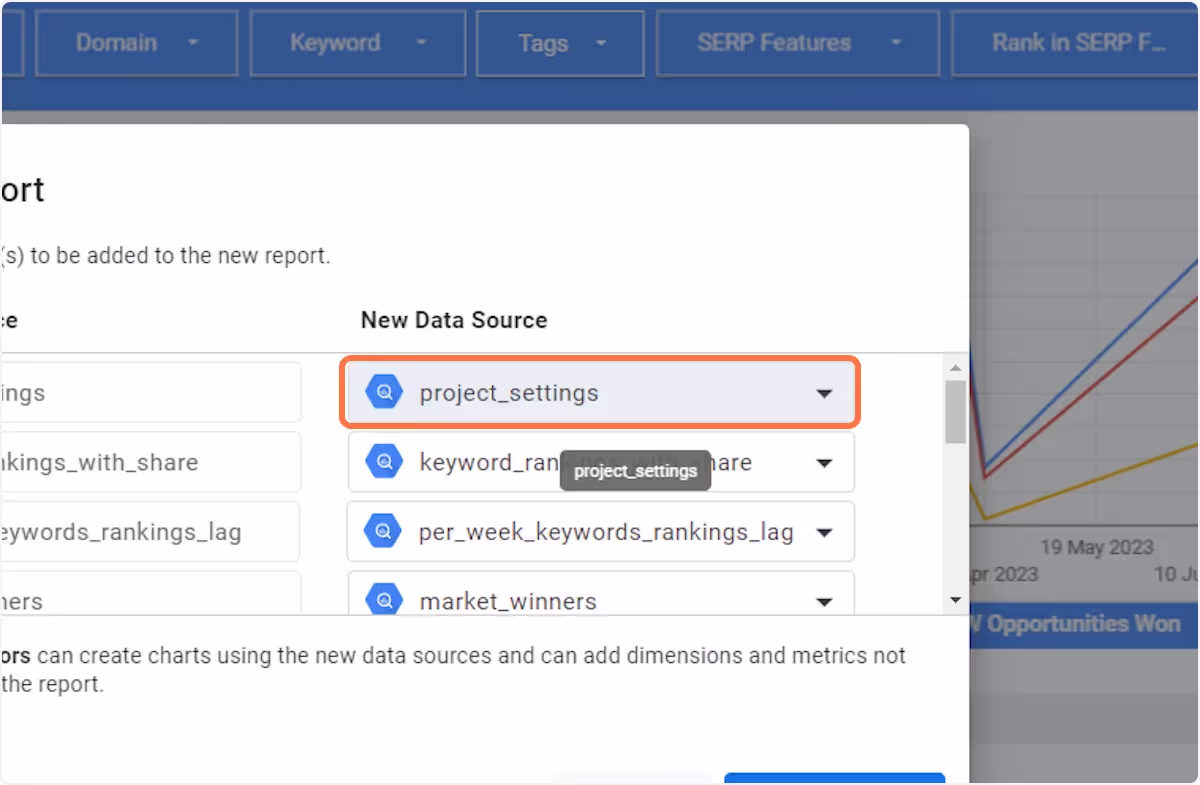
Then you need to connect each table to exactly the same named table or view in your Big Query Project and Dataset. For example, here I click on 'project_settings'.
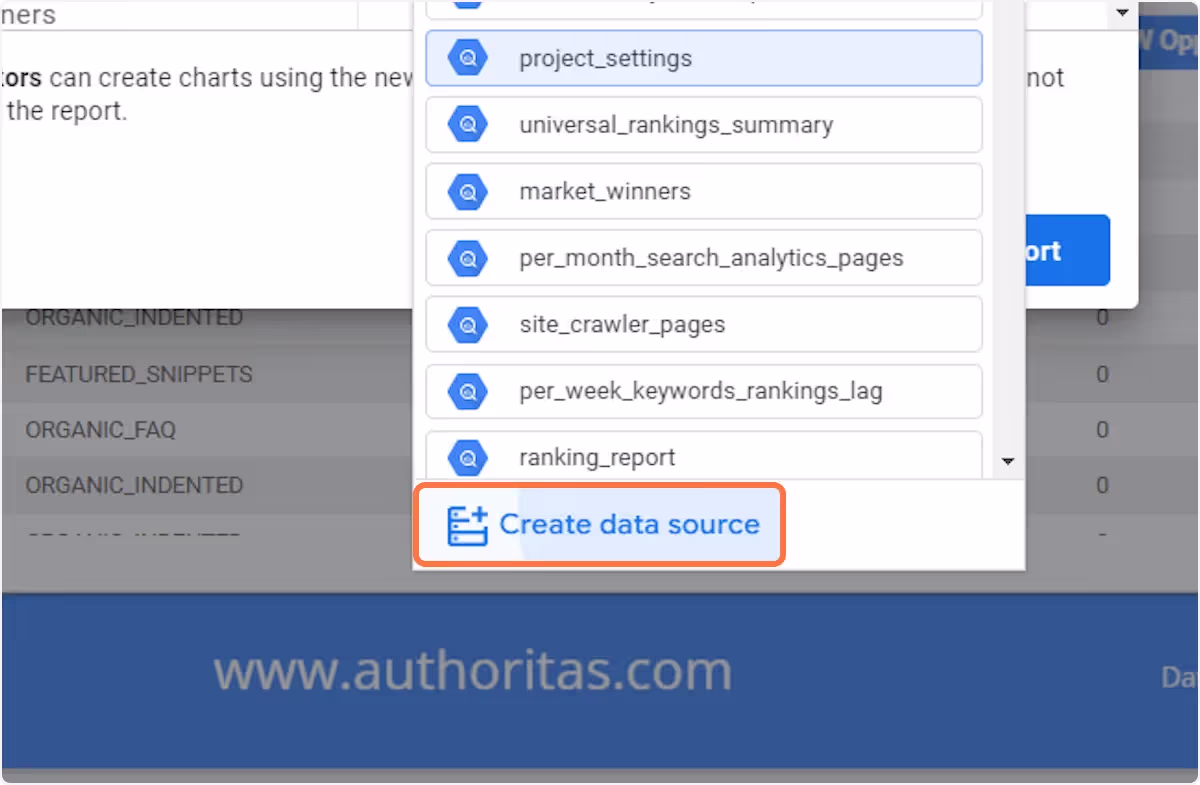
Then I click on 'Create data source'.
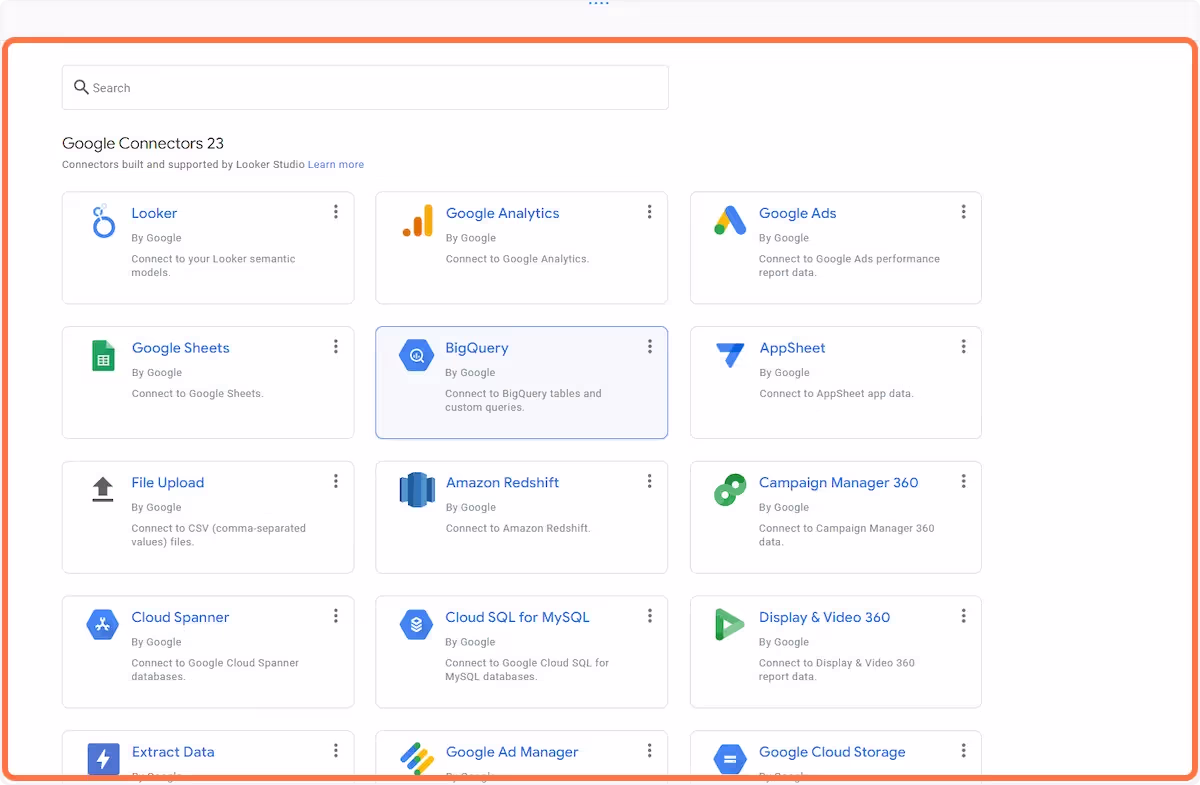
This takes me to the Google Connectors screen where I click on 'Big Query'.
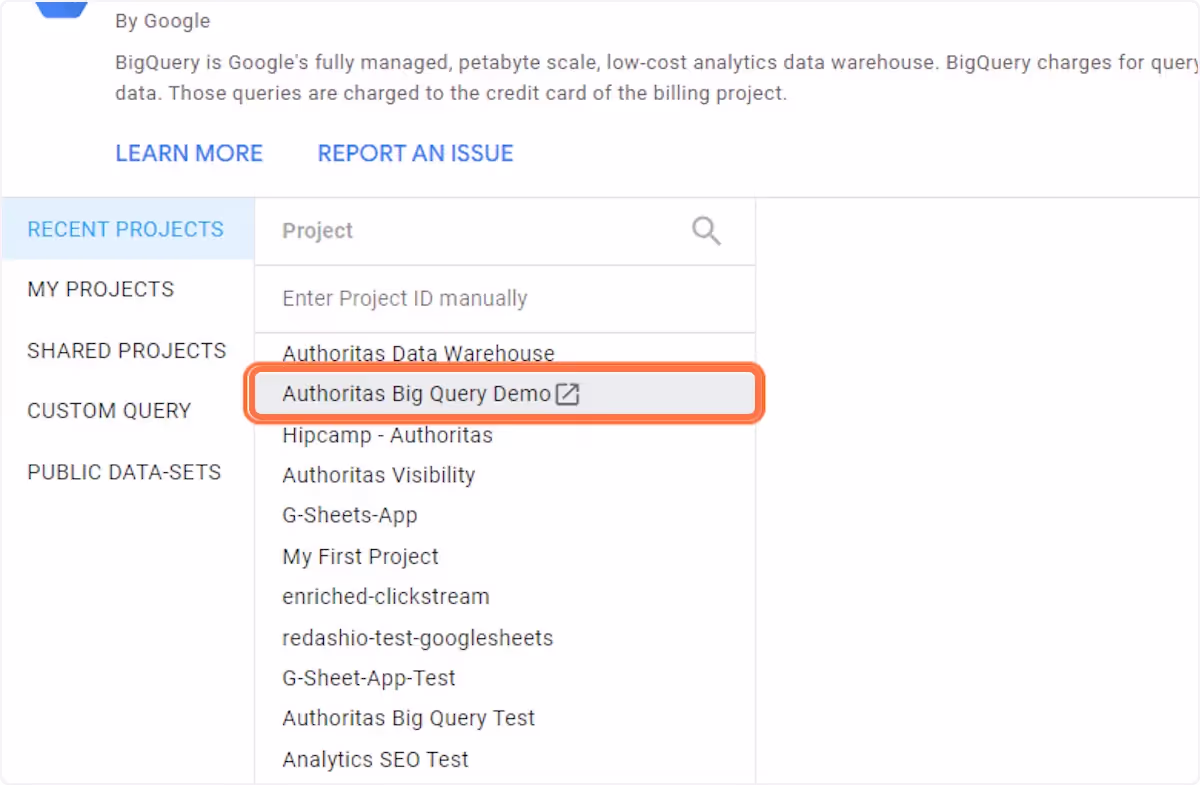
Then I click on my Big Query Project name, 'Authoritas Big Query Demo'. Yours will of course be named how you named it.
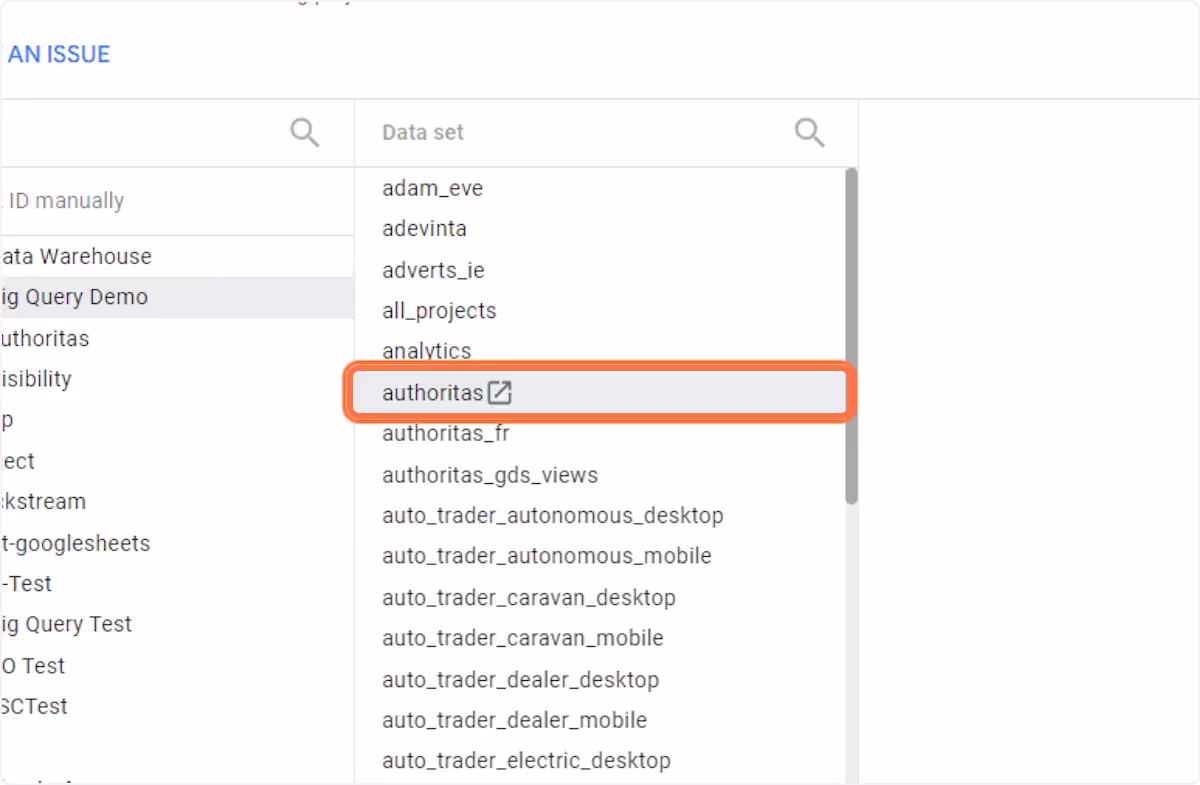
Then I click on 'project_settings'. You will also have a table called 'project settings'!
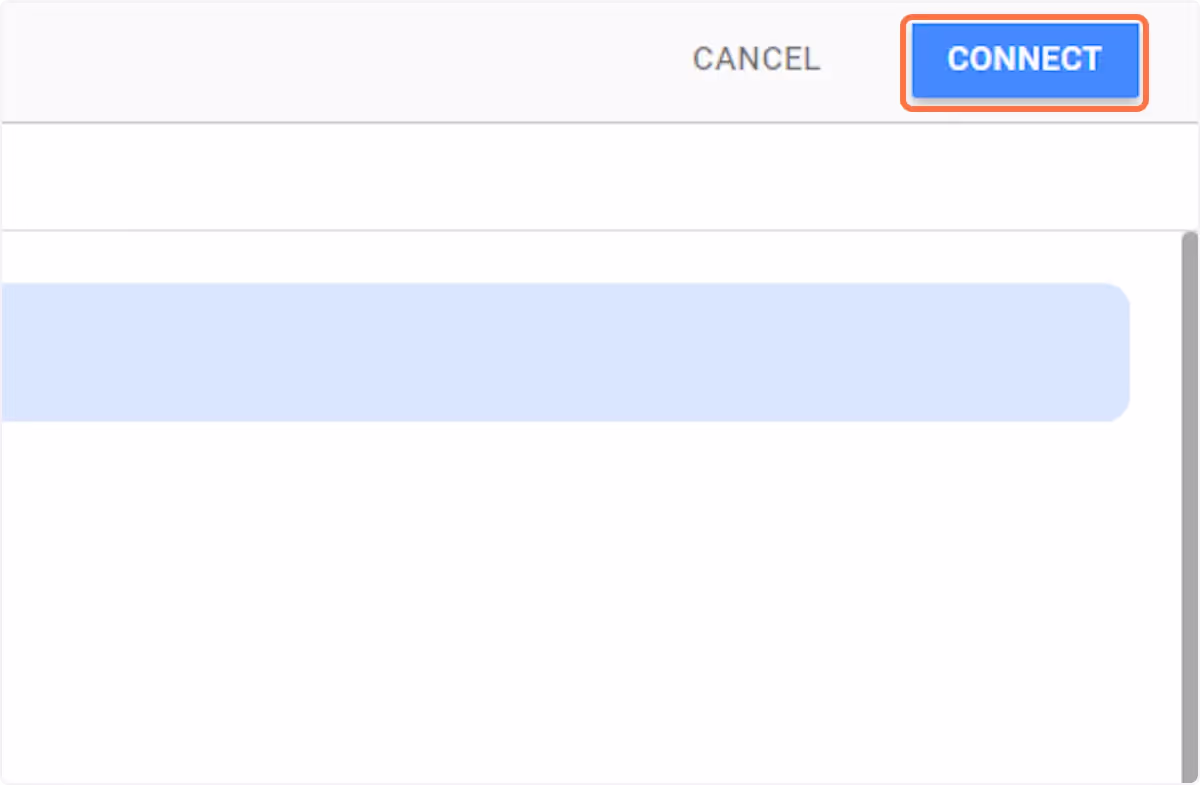
Then I click on 'CONNECT'
Connect the data
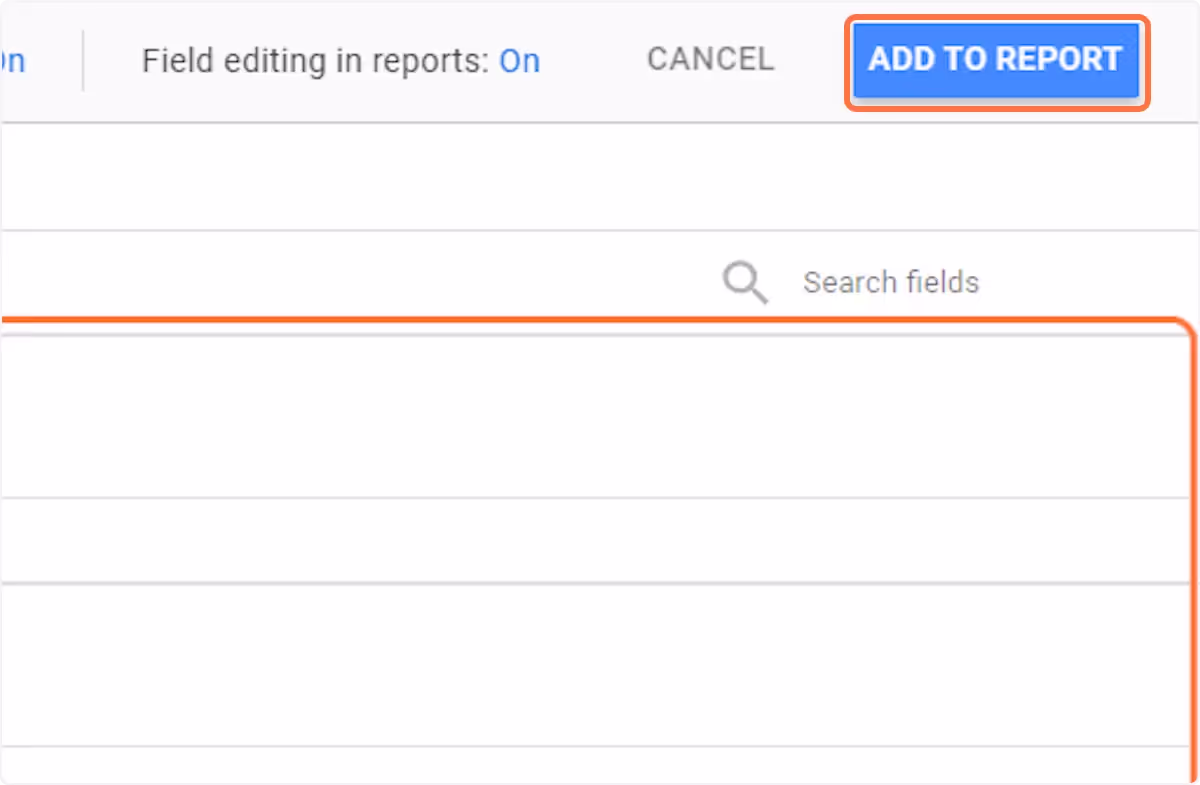
And then I click on 'ADD TO REPORT'.
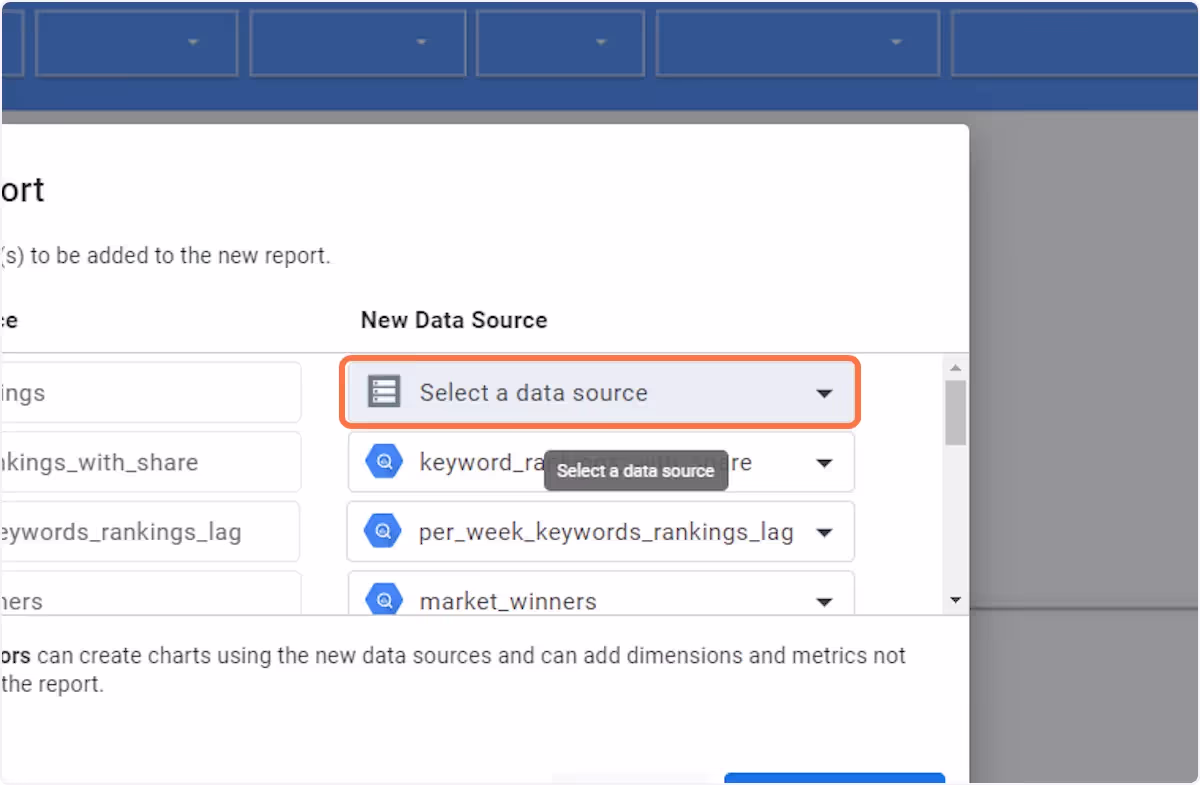
Once you have done this successfully, rather annoyingly Google now shows this table as 'Select a data source'. But it does mean it has been successfully linked. Now you just need to do this for each of the remaining tables (there are around a dozen).
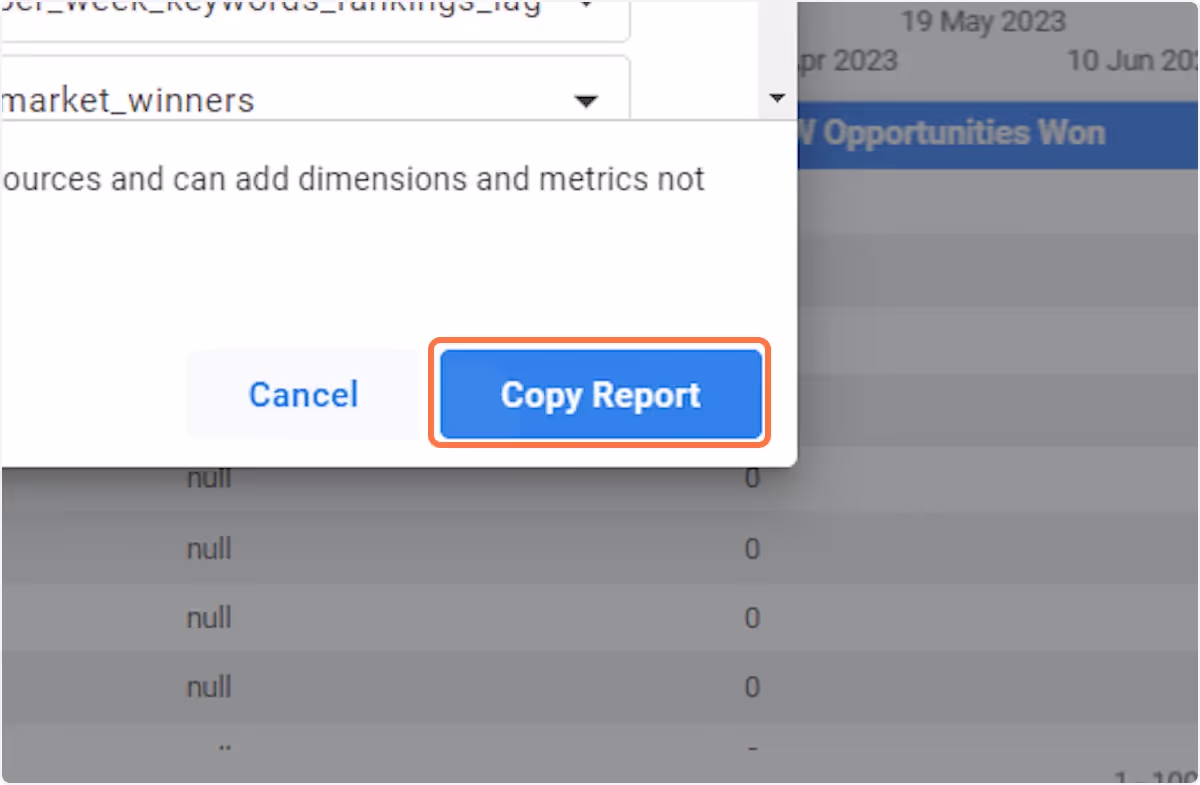
Once you have done this for all tables then you can click on 'Copy Report' and your report will be created.
Hopefully, you will find the report easy to create and find the new pages useful.
Do share your feedback and suggestions with us!


