A Practical SEO to On-Page SEO
This guide goes into detail about how to improve your On-Page SEO strategy with a set of actionable topics and tasks for you to consider when optimising your pages for users and search engines.
The Benefits of On-Page Optimisation
This is one of a series of expert community-authored guides on different important aspects of search engine optimisation, this guide goes into detail about how to improve your On-Page SEO strategy.
Google makes thousands of minor algorithm updates a year (3,620 in 2019 alone) and we’re on a mission to help you keep up with the changes affecting your website. Together with our SEO expert authors, we plan to maintain these guides as a current resource of useful, pragmatic advice for SEOs that can have a positive influence on your site’s organic sessions over time.
As community authored guides, you are welcome, not just to read and share these pages, but to also contribute through questions, comments or suggestions and should you so desire you are welcome to offer to write additional sections that need improvement or cover important gaps in these guides.
Effective on-page SEO has always been a foundational element to any successful SEO campaign. However, what constitutes good on-page SEO techniques today is a far cry from the ‘good old days’ of keyword stuffing Meta titles, descriptions and keyword tags or stuffing keywords and synonyms in heading tags and your page content.
Larry Page once described the perfect search engine as, “exactly understanding the user’s intentions and giving them the exact answer they are looking for”.
Your primary goal with on-page SEO in 2020/21 is to ensure that your pages provide the best answers for the queries and questions your prospective customers are typing (or speaking) into Google. Because that is what Google wants to deliver to its users.
So putting together great content is key. But your competitors are also attempting to do the same. So all other things being equal, other factors such as on-page usability and user experience, as measured by Google, become increasingly important factors in ensuring that you beat your competitors to top spot.
This guide to on-page SEO, or page-level optimisation as it is sometimes referred to, is designed to help you navigate through the relevant ranking factors that you need to consider when designing and constructing your website and writing your content.
There are a number of different areas to get right. Excelling in one is not enough; to win you need to take a ‘Slight Edge Philosophy” and try and benchmark yourself against your key competitors across all these factors and be that little bit better than them across the board.
Of course, that’s easier said than done. But hopefully, this guide or checklist will help you navigate what you need to do to improve your rankings to generate more relevant traffic that converts.
We’d like to thank our co-authors for sharing their expertise with us all and if you would like to contribute to this or any of our other Ultimate SEO Guide series then please get in touch.
Chapter 1 - Understanding User Intent
There have been huge volumes written about the importance in SEO today of understanding keyword intent or as we prefer to phrase it ‘User Intent’. It is now seen as an essential part of the SEO keyword and audience research process.
We’ve written extensively about it ourselves on our blog, covering our philosophy for interpreting user intent for SEO and debunking some of the dictionary-based approaches favoured by some leading SEOs; we have produced a Tea Time SEO session on YouTube with some well-known industry experts and have some great new features in the core SEO platform that can add user intent scores for each of the 4 main types of search intent to your keyword research and rankings.

The 4 types of Search Intent
- Navigational – the user is looking for a specific entity: e.g. A company, website, brand, product, event, location, social media handle, etc.
- Informational – the user is looking for general facts or information about a topic that has no commercial intent.
- Research – this is ‘commercial research’ where the user is researching a product or service and is looking for relevant data about what to buy and where to buy it to inform their decision.
- Transactional – the user has narrowed their research and is now looking to purchase a specific product or service.
However, in practical terms not so much has been written about what you can do with this intent data. In practical terms, as an SEO what can you do with this data that gives you an edge over the competition?
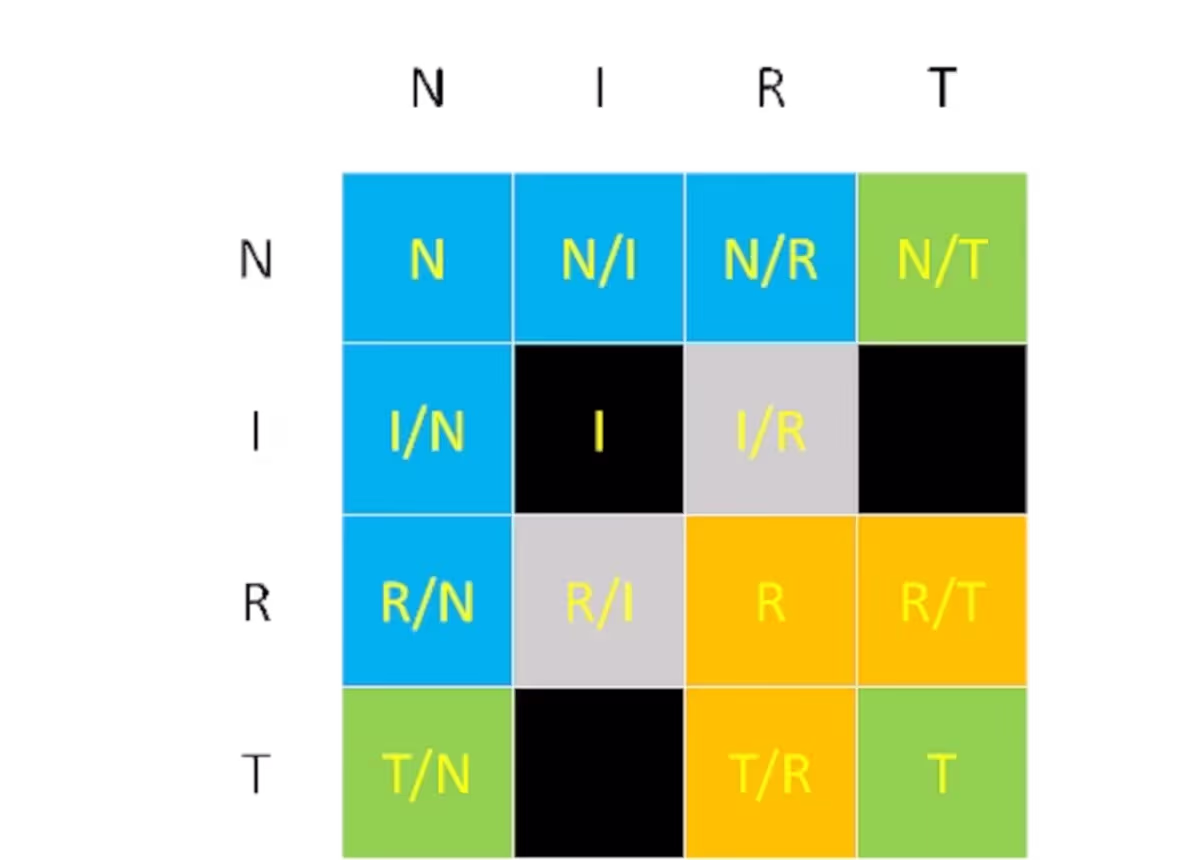
Well firstly, take a look at the following 4×4 matrix. The intent behind some search queries do fit nicely and neatly into one category. But in many cases there is not a dominant user intent and a keyword or group of related keywords will sit across two categories, sometimes three if there’s a bit of brand in the term.
Understanding The “Smell of the SERP”
By categorising and organising your keywords into keyword groups by user intent, you can start to understand the buyer journey and map your content accordingly.
By seeing which groups of keywords and related pages are higher up the buyer funnel you can match your on-page content to the users’ needs and give Google and its users what they want.
Once you have these groupings, all you need to do is understand the “Smell of the SERP”. This is a term first coined by a leading French SEO and friend of Authoritas, Laurent Bourelly.
It conveys a simple notion; what does the SERP smell like for a particular keyword or set of related keywords? What type of pages is Google showing in the top ranking positions and does your content match?
Take these two examples:
Example 1: If you want to rank well for users searching for queries related to ‘best family cars’ then you’ll probably find that Google is favouring high quality articles written by automotive experts from well established industry publications, motoring websites and newspapers with motoring sections that contain long paragraphs, interspersed with high quality images and videos. If you want to rank well for these queries then you need to ensure you have the right kind and format of content and layout to match.
Example 2: If you want to rank well for users searching for queries related to ‘second hand SUVs’ then you’ll probably find that Google is favouring category or search listing pages from well established classified sites. If you want to rank well for these queries then you need to ensure you have the right kind and format of content and layout to match.
If you find that some of your key landing pages are ranking well for one group of keywords and not so well for other small clusters of keywords, then this could be a good indicator that your smell is off!
You may be better off creating a new page(s) with the right content types and layout to target the keywords where your site and page is deemed relevant enough to rank reasonably well, but the page quality does not quite necessarily match the users’ needs well enough to rank much higher for these terms.
We’ve all seen many instances of SEOs optimising eCommerce category pages with additional text to try and improving its ranking and whilst there are many cases of this working to some extent, John Mueller, Webmaster Trends Analyst at Google has warned against adding so much content that you risk confusing Googlebot’s analysis of your page type by mixing informational and commercial research/transactional intent too much.
Tip – So don’t overdo it. But with a greater in-depth understanding of the user intent of your keywords, how this maps to your pages and what type and formats of content Google really wants in each micro-topic, you are well set to build a great SEO and content strategy.
Chapter 2 - Google’s Search Quality Raters & EAT - Is your Content king?
We’ve already seen that Google is hell-bent on providing the very best answer or answers to a user’s query.
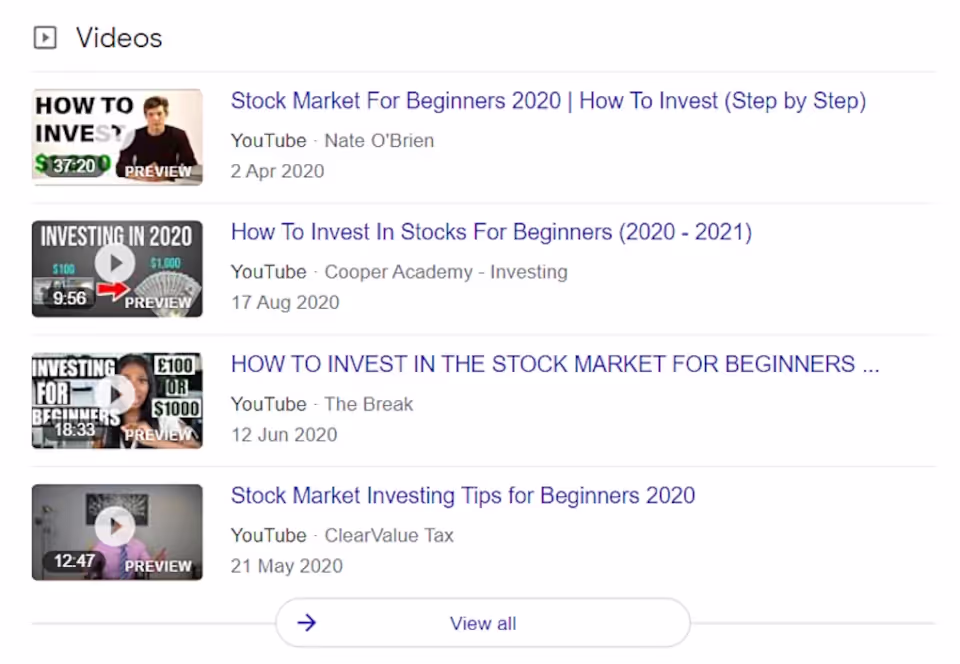
This is evident in the SERPs with the recent proliferation of new Universal SERP features that seek to give the user a quick answer to their query. Here’s just a selection – some of which you can optimise to rank for and some you cannot;
This means not only do you need to produce good quality content that answers users’ questions, but your on-page content needs to be in the right format (e.g. Some results return a Featured Video at the top of the page – more often than not set at the exact point in the video that answers your question) and structured in the right way to give it a chance to occupy some of these Universal SERP features and not just focus on the organic rankings.
So, what constitutes high, quality content? Surely, this could be somewhat subjective?
Well arguably it might be subjective. But ultimately, Google has to train its algorithms to rank the most useful pages higher and this means it looks for signals to help it determine that a particular page is more suitable an answer for a given query than another.
Google uses an army of people to help it fine tune its algorithms. They are freelancers working from home across the world in multiple languages and they have a specific set of guidelines (Google Search Quality Rater’s Guidelines) that they use as a reference to complete the tasks that are assigned to them. These tasks are designed to help them rate websites and pages on areas such as Page Quality and Needs Met for mobile users.
Page Quality Rating
Lowest
Lowest+
Low
Low+
Medium
Medium+
High
High+
Highest
Needs Met Rating
Needs Met rating tasks ask raters to focus on mobile user needs and determine how helpful and satisfying the result is for mobile users. If anything this shows the focus Google has on mobile and you should think mobile-first too.
Fails to Meet (FailsM)
Slightly Meets (SM)
Moderate Meets (MM)
Highly Meets (HM)
Fully Meets (FullyM)
Please note, these individuals are not training the algorithm as such, nor can a poor or good rating on your site affect your rankings. They are merely providing Google with some measurable feedback on the effectiveness of the experiments it is running that might relate to Google Search experiments in production or future ones that they are currently assessing.
Google has been pushing webmasters to produce good quality content for a long time and have introduced algorithmic changes that make old, popular SEO techniques like article spinning defunct. Google released a condensed version of their guidelines back in 2013 and then released the full version in 2015. The latest version runs to more than 160 pages and has many good and bad real-world examples of SERP results and how to rate ranking pages and its rationale behind this.
If ever there was an essential reading list for SEOs then this would be on it!
Tip #1. Anyone working on the content on your site should have some training on this.
The guidelines are where we first heard about ‘Your Money or Your Life’ pages (YMYL). Google places great importance on these sites as they can impact someone’s life, e.g. They are about medical, health and financial topics, such as financial transaction pages within ecommerce sites.
These sites especially should have EAT – Expertise, Authority and Trust.
The site should show why those who are giving the recommendations on the YMYL pages have the expertise (i.e. Display their credentials), the authority (i.e. They are well known in the industry) and they can be trusted (i.e. Reviews, citations from other industry resources).
The complete Search Quality Guide covers assessing the quality of the website, but here we’re just focused on a specific page and these are the main factors that they consider when assessing the overall page quality.
- The Purpose of the Page
- Expertise, Authoritativeness, Trustworthiness
- Main Content (MC) Quality and Amount
- Website Information/information about who is responsible for the MC
- Website Reputation/reputation about who is responsible for the MC
Tip #2 – So why not do your own internal (or even external anonymised testing) to see how your key money pages compare to your competitors on the Page Quality and Needs Met scales. Perhaps, this might give you some useful insights into discernable differences between your pages and higher ranking competitors and suggestions of changes you can make to your page to improve the user experience.
Tip #3 – If you really want to get a feel for what Google is looking for then sign-up to become a Google Search Quality Evaluator yourself. Google has recruited in the past through companies like Appen and Lionbridge. Alternatively, the low-cost online Search Quality Evaluator courses run by a former Search Quality Rater give you a good sense of what it is like to evaluate websites.
Tip #4 – Don’t just think about producing the content. Do your keyword research – which keywords generate Featured Videos, which keywords generate Featured Snippets and are they in a table, list or paragraph format? Professionally produced content that’s the right combination of content types or formats, in the layout Google favours (e.g. Articles or category pages) all combine to produce great content.
Chapter 3 - Building a first rate User Experience and Page Experience
Ask yourself this question – is my site painful for its users?
Google wants to deliver the best experience for its users and that means serving them the most relevant, authoritative answers from trusted sources to the questions they need answering.
But what happens when it’s difficult to make a case for Page A or Page B to rank highest for a particular term?
As experienced SEOs, we’ve all seen rankings jump around from time to time outside of a widespread algorithm update and we know for sure that Google runs experiments and analyses vast amounts of anonymised user data to help it make the best decisions. These experiments or click-thru rates in either position might sway the top ranking in favour of Page A over Page B or vice-versa.
But when all other things are equal then the User Experience and Page Experience offered by Page A over Page B could prove to be telling.
Google has given us fair warning that this is important – announcing that page speed was a ranking factor back in Spring 2010. It went on to announce that it was introducing mobile first indexing back in March 2018 and recently announced that all sites were moving to mobile first indexing in September 2020.
Measuring your User Experience on Mobile
So we know Google uses the mobile version of a site’s content for indexing and ranking and places tremendous importance on ensuring users get a good experience.
For SEOs this means you have to test your mobile site’s usability and fix any issues that might impact mobile users enjoyment of your content. Typical problems include; huge image file sizes, content too wide for the screen, clickable elements too close together so buttons are hard to click, and text so small it’s illegible.
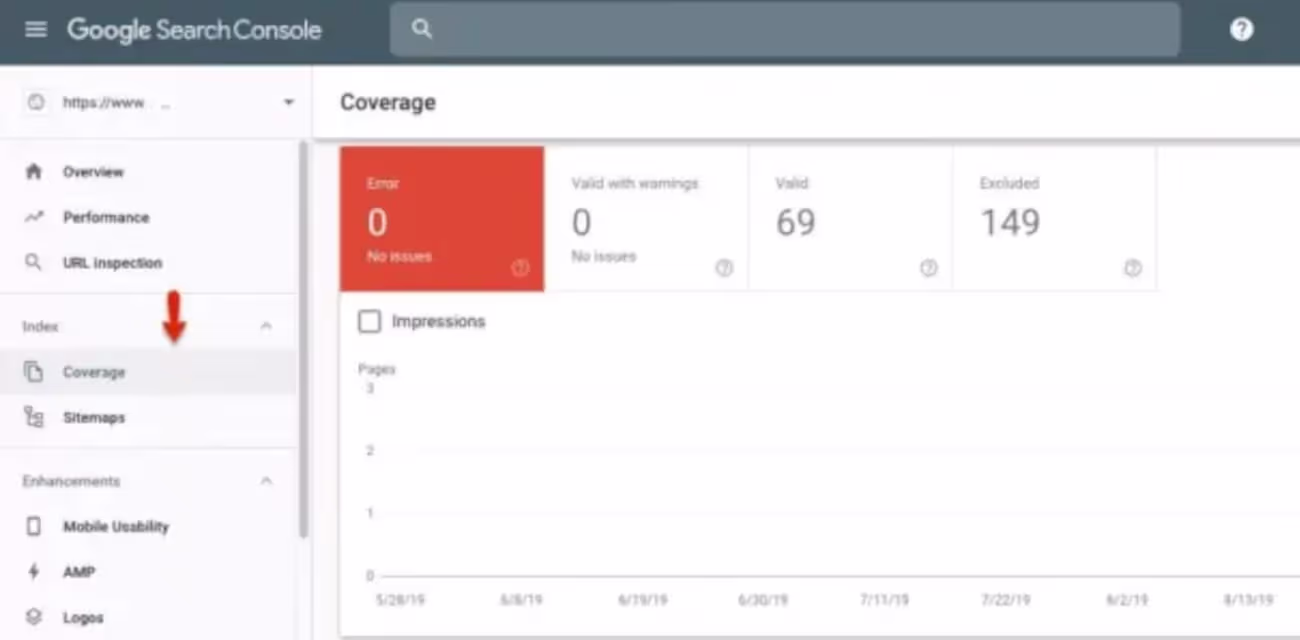
You can see some of these errors reported in Google Search Console. Fix them!
But don’t wait for Google to report these issues – especially as validating you’ve fixed some of these issues can take as long as 28 days. Use the following tools to help:
Google’s free mobile friendly test – https://search.google.com/test/mobile-friendly
Smart Bear – Cross platform browser testing – https://smartbear.com/ – to make sure your site loads nicely in all modern browsers.
And do your own usability testing to discover other issues that may not necessarily be reported on today, but are likely to turn real-users away (and one day search engines when they build a test for this too) such as sub-menus not being clickable, no search functionality, no contact details and so on.
Measuring your Page Experience on Mobile (and Desktop)
But don’t wait for Google to report these issues – especially as validating you’ve fixed some of these issues can take as long as 28 days. Use the following tools to help:
Google’s free mobile friendly test – https://search.google.com/test/mobile-friendly
Smart Bear – Cross platform browser testing – https://smartbear.com/ – to make sure your site loads nicely in all modern browsers.
And do your own usability testing to discover other issues that may not necessarily be reported on today, but are likely to turn real-users away (and one day search engines when they build a test for this too) such as sub-menus not being clickable, no search functionality, no contact details and so on.
What are Core Web Vitals? What is the Google Page Experience update and when is it coming?
Google completed the roll out the new Page Experience update at the end of August 2021, making Core Web Vitals ranking factors.
Core Web Vitals is the new way to see (in real time) and measure the performance of a website. Some of you may already be familiar with the three elements you have seen in Google Search Console:
Largest Contentful Paint (LCP)
First Input Delay (FID)
Cumulative Layout Shift (CLS)
Core Web Vitals, also called Web Vitals are the performance metrics that affect User Experience including how fast the page loads, the visual stability (if the page jumps) and the interactivity. Google has introduced this as many sites are still loading incredibly slowly. The speed of a site affects bounce rates, time on site and conversions. So no more slow sites! If your site is still performing poorly by then, it will be harder for it to appear higher in the SERPs.
Making your pages load faster for users - Improving your Core Web Vitals
Take a few examples of some of the key pages on your site and check their performance using Lighthouse, GT Metrix or Google Page Speed Insights.
Tip 1 – Test your key Page Templates
Ideally you should select a number of page templates that cover a large proportion of your overall site pages. This way by fixing the obvious issues with a few templates you can have a positive impact on many pages. This is important as Google will use average Web Vitals data for your site if it doesn’t have data from enough real users for a specific page.
Tip 2 – Don’t focus on the overall headline score for mobile and desktop! It fluctuates!
Google recommends taking a couple of readings every time you make a change to get a more consistent view of progress. Honestly, if you focus on the overall score it will drive you mad, as you will make a change that you think improves the overall score and it will go backwards – or it will improve the Desktop score and make the Mobile score worse.
Instead focus on the key metrics for the Core Web Vitals:
- First Contentful Paint (FCP) is an important, user-centric metric for measuring perceived load speed because it marks the first point in the page load timeline where the user can see anything on the screen—a fast FCP helps reassure the user that something is happening
- Speed Index measures how quickly content is visually displayed during page load.
- Largest Contentful Paint (LCP) is a Core Web Vitals metric and measures when the largest content element in the viewport becomes visible. It can be used to determine when the main content of the page has finished rendering on the screen. The most common causes of a poor LCP are: Slow server response times
- Time to Interactive measures how long it takes a page to become fully interactive. A page is considered fully interactive when:
- The page displays useful content, which is measured by the First Contentful Paint,
- Event handlers are registered for most visible page elements, and
- The page responds to user interactions within 50 milliseconds.
- Total Blocking Time (TBT) metric measures the total amount of time between First Contentful Paint (FCP) and Time to Interactive (TTI) where the main thread was blocked for long enough to prevent input responsiveness.
- Cumulative Layout Shift (CLS) measures the instability of content by summing shift scores across layout shifts that don’t occur within 500ms of user input. It looks at how much visible content shifted in the viewport as well as the distance the elements impacted were shifted.
Then focus on solving the issues raised by your page speed reporting tool. I recommend using at least two tools.
Once you have found a friendly web developer and fixed all the obvious issues, then finally, think about what changes you could make that would create a better user experience – and by better, I mean making your page templates load faster and be ready for a user to interact with sooner.
Striving for 100/100 is not completely unrealistic, I have seen a few examples of sites with home pages that score this well, but it may not even be necessary to go to the nth degree.
Eventually the law of diminishing returns applies.
Google itself says that going from a score in the 90s to 100 can take a huge amount of effort and even Google’s own search page does not score top marks!
Tip 3 – Benchmark against your competitors page templates or key landing pages and just focus on ensuring you out score your competitors!
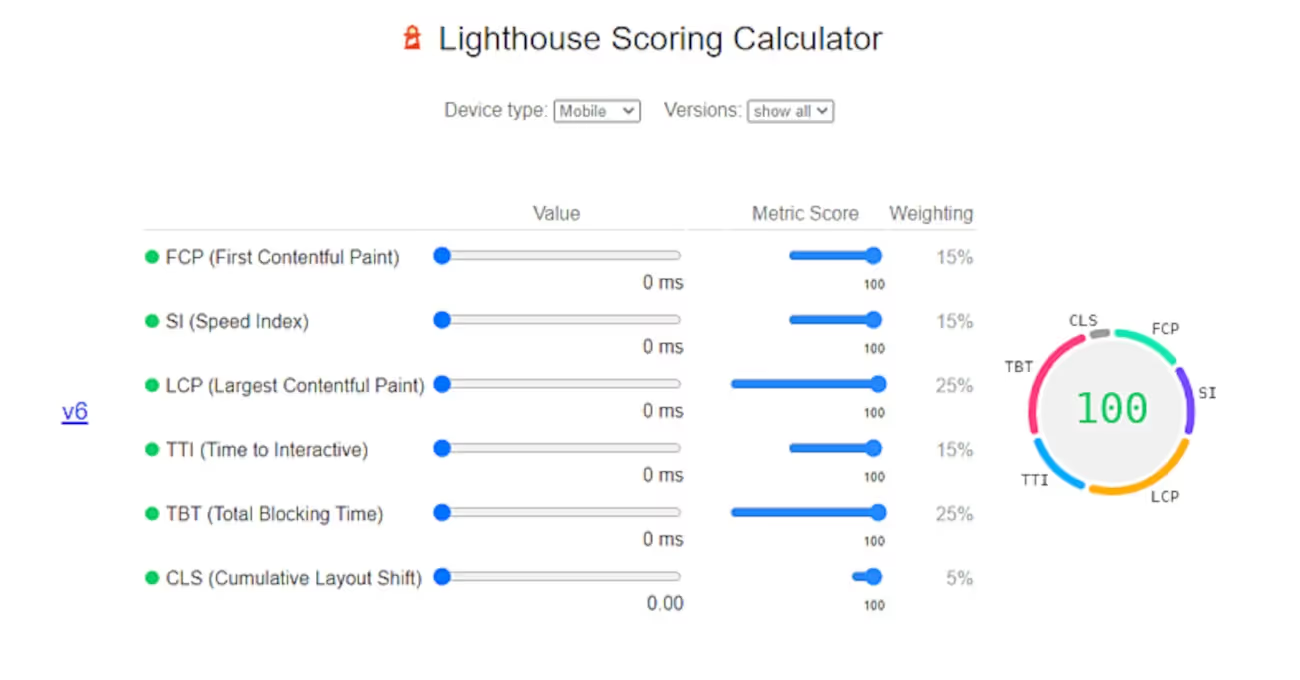
Tip 4 – Use Google’s Lighthouse calculator to see the weighting of each of the Core Web Vitals and to work out how great an improvement you need to make to get everything in the green zone, scoring 90 – 100.
Set yourself a realistic goal of beating your competitors’ pages. Run a report first and then click on the ‘See calculator’ link below the Core Web Vitals in the Lab Section, as then the calculator will show your performance levels and it’s easier to drag and drop the sliders to see what you need to do to reach your goals.

Tip 5 – Implement AMP to accelerate your mobile pages.
Tip 6 – Prepare for your performance to drop in the future!
I’m afraid you cannot just fix and forget this. You will do all this work and then someone will change something on your website and your performance levels and scores will drop again.
After all your website should be regularly updated with fresh content and features; so it’s highly likely someone will inadvertently undo your good work on improving the page experience for your users.
So either set yourself some alerts that automatically check your scores and performance levels against your attained benchmarks and/or use Lighthouse’s CI tool (or some cloud based tools that do the same) to set a Page Experience budget that is integrated as part of the cContinuous Integration and testing framework built into your development process. For larger sites, this should ensure that any future site changes do not cause a regression in your page experience performance levels.
Chapter 4 - Structuring your website and your pages
OK, this might be a section to skip for experienced SEOs. Even, if you are relatively new to the field then you will likely have read plenty of advice from industry veterans on how to structure your website properly for search engines.
So we won’t go into huge detail in this section, but suffice to say here’s a list that conventional wisdom amongst SEOs says is generally accepted best practice.
- Ensure your URLs are search engine friendly – Keep URLs short and sweet. Use relevant keywords and try and keep your site structure simple and not too deep. e.g. Only 1 or 2 folder levels deep. www.[yourdomain.com]/folder1/your-keyword-friendly-page/ or www.[yourdomain.com]/folder1/folder2/your-keyword-friendly-page/
- Ensure your internal links are meaningful and don’t cannibalise yourself – Try and keep the anchor text of your internal links consistent (e.g. Using synonyms for the keywords you want the target page to rank for) and do not link to different pages with the same anchor text if you can to avoid sending mixed messages to the search engines.
- Ensure your Web Server is properly configured – A fast well configured Web Server that caches static content to serve content fast to users is essential nowadays – as is using tools like image compression and CDNs to serve content to users as fast as possible. But don’t forget simple SEO checks like that the HTTP Response Header the server returns is valid and does not contain ‘no-index’ or ‘none’ – this is not the message you want to be giving to search engines!
- Double-check Basic Technical SEO Health Checks – It’s worth checking that your robots.txt file is properly setup and that you’re not using meta data tags like this in the head of your page <meta name=”robots” content=”noindex”> or to prevent only Google web crawlers from indexing a page: <meta name=”googlebot” content=”noindex”>.
- XML Sitemaps – Googlebot will probably discover and index your content anyway. But why not make it easy for it by ensuring your sitemap(s) are listed in Google Search Console. This will help you spot any issues – but also check key landing pages are included. We’ve seen plenty of examples over the years where key category or product pages are missing from a site’s XML sitemap.
- Breadcrumbs – Implementing breadcrumbs are a great way to help users and search engines understand and navigate your site.
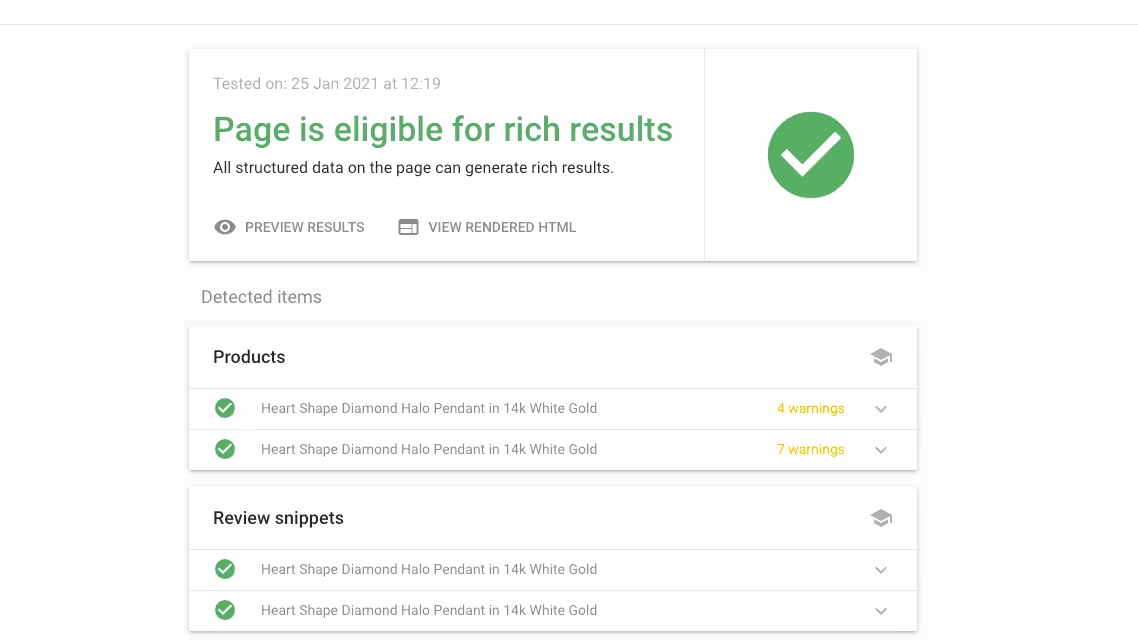
- Schema Markup – It’s no secret that Google, Bing, Yandex and Baidu all use plenty of machine learning algorithms to help them with Natural Language Understanding of your unstructured content. But you can make more of your content machine readable simply by adding structured data to your content. This will help search engines understand what your site is really about and will also increase your change of ranking for certain SERP features like Featured Snippets, People Also Ask and Organic FAQs.
- Get the SEO On-Page basics correct – Use your favourite SEO tool to ensure you have solid foundations to build on:
- Unique page titles and descriptions
- Logical heading structure
- Canonical tags to resolve duplicate content issues caused by common problems like faceted search in eCommerce sites
- Correct use of Href lang tags for international site
- Image alt tags
- Ensure your pages serve a purpose and reduce or eliminate thin pages that will reduce your overall site quality
- Compare the content and layout of your pages to your key competitors – what are you missing? What are they doing that’s better than your page? Imitate and improve!
- AMP – Google’s Accelerated Mobile Pages project is designed to solve one of the common pain points for mobile users of slow loading pages (especially on poor internet connections) by pre-caching the pages the user is likely to visit. AMP pages load almost instantly. You can read more about AMP here – you will also find a good selection of plug-ins for most content management systems which make it easy for you to AMP enable your website.
- (Advanced) Build your own Knowledge Graph! Google understands entities not just keywords and it uses this to power its Knowledge Graph and in return this has an impact on its ranking model for certain queries.
This is a big topic – if you would like a simple primer then try this article by one of our Tea Time SEO speakers Dave Davies of Beanstalk Internet Marketing. Bill Slawski has also analysed related Google patents to shed light on how Google may be using its understanding of entities in its ranking models.
As it relates to on-page SEO what relevant advice can we give you?
Tip 1 – Reference relevant entities in your content and consider linking to them.
Tip 2 – Mark-up your content to show how you relate to these entities. This goes beyond basic schema markup to create a vocabulary of relevant entities that relate to your content that you can mark-up using linked data publishing mark-up to reference.
There are some great tools like WordLift.io that can do the heavy lifting for you. (Editor’s Note: We’ve just implemented this and will update this guide when we have more results).
Chapter 5 - External Link Profile benchmarking and Reputation Management
Quality backlinks from relevant sources are the lifeblood of your SEO campaign. Once you’ve established solid technical foundations and have invested in producing quality content then what else can you do other than promote your content organically via PR, social and ads, and/or if you want to risk it then via paid link campaigns.
It’s worth noting at this juncture, in Google’s Search Quality guidelines the reputation of the website itself has a bearing on the PQ rating;
“You must also look for reputation information about the website. We need to find out what outside, independent sources say about the website. When there is disagreement between what the website says about itself and what reputable independent sources say about the website, we’ll trust the independent sources.”
So tackle link building in a couple of stages:
Stage 1 - Get your house in-order
Before you even worry about what others are saying about you, ensure you are consistently describing your company, your contact details and what you do on your website and any external reputable sources that you can control, for example:
- Your website(s) – Tip 1 – Use Schema markup to help search engines understand you better
- Products on your website – if you are an eCommerce website then you’ll know that product reviews have a big influence on your sales. Include Product rating schema in your pages.
- Industry awards and accreditations, customer testimonials – adding these to your sites to add to your perceived Expertise, Authority and Trust is good – it’s even better if you can get these sites to link to you.
- Google Places
- LinkedIn Page(s)
- Twitter profile
- Facebook pages
- Instagram profile
- Other social media accounts
- Local business directories, Better Business Bureau, local chambers of commerce and industry associations or affiliations consistently describe and link to your company.
- Business directories like Crunchbase or others specific to your industry
- Review websites like TrustPilot, Reevoo (these will vary by country)
- G2 Crowd, Capterra, Software Advice (for software companies)
- Sites that Google may use as reference points for building its Knowledge Graph include Crunchbase, Google Books, IMDB and any other specialist data sources such as a registry of dentists/doctors. Jason has written a full list on his site Kalicube.
Ensure that your website and each article or post makes it clear who (what individual, company, business, foundation, etc.) created the website or the content on the page.
Stage 2 - Manage your online reputation
Hopefully, you won’t have disgruntled customers denigrating your company on any of the platforms in Stage 1 or worse still creating dedicated [yourwebsite]sucks.com types of sites to try and spite you. If you have, then you need some professional help beyond the scope of this guide.
However, many of the sites mentioned in Stage 1 are important in helping create a positive image of your business. So manage your reputation on these sites.
Get your customer support people to ask happy clients for a review on one of these sites and rotate this until you get good coverage and a solid rating and reputation across all of them.
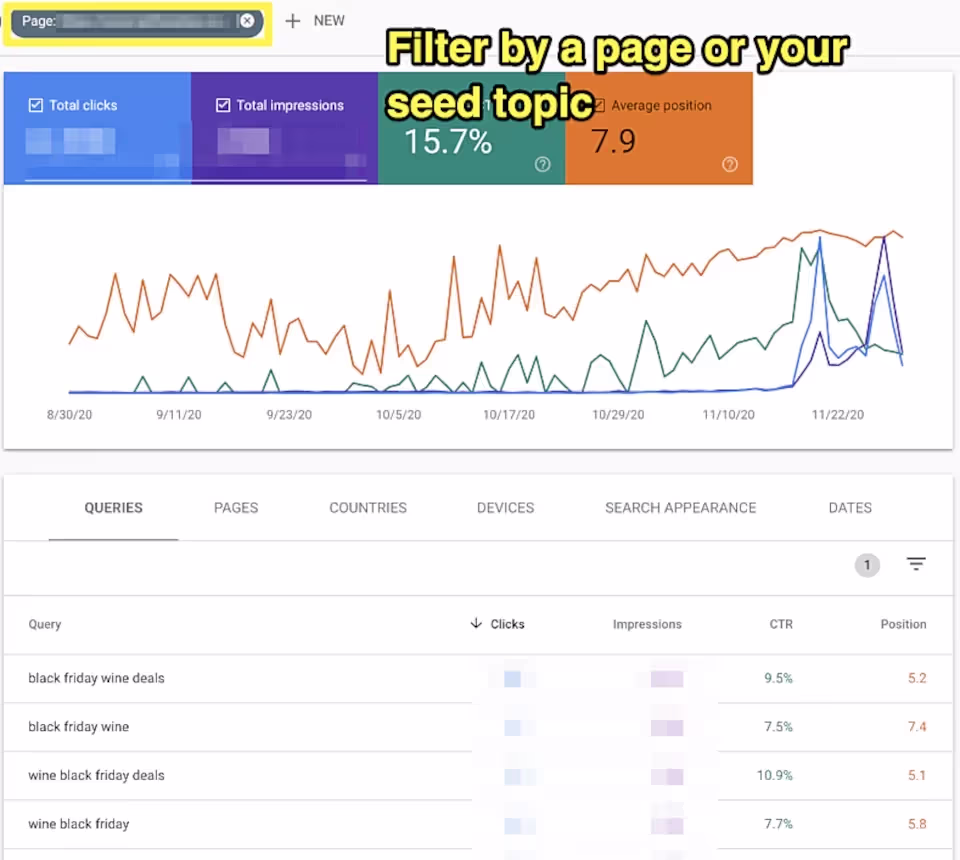
If you are not sure which sites are the most important for your niche, then you can research them for free in the Authoritas SEO Visibility Tool. Discover which sites are ranking well in the SERPs for your related keywords and target them.
Here’s an example of software review sites that we analysed for our own internal marketing.

This shows us that G2.com is the most visible website in the UK for software reviews in general.
You can then filter this view to only look at their Visibility for relevant keywords and in our example we found that leading review sites like Capterra and G2 ranked in the top few places for very relevant keywords.

It then becomes essential to manage (and even consider advertising) on these software comparison review sites as they may help your overall SEO visibility but more importantly they can bring you relevant buyers.
Stage 3 - Compare your Link Profile to the page with your competing pages
Many tools such as Authoritas allow you to analyse your backlink profile at a domain level.
However, this can be far more useful and informative if you look at your individual key landing pages and compare the relevance and Authority of your landing pages to your competition.
At Authoritas we have always recommended Majestic link data – but whichever link data you use, try and assess topical relevance as well as domain or page authority metrics (whether you prefer Majestic or Moz or your own in-house metris).
Figure 1 – Quality and Relevancy Matrix
With the Authoritas platform you can define a list of relevant terms and when we re-crawl the backlinks we get from Majestic to your site we add an additional layer of value helping you to see whether the links are from relevant or influential sites.
If you also add competing pages to the link analysis section then you should be able to download the data and produce a simple scatter graph in a platform of your choice (Excel, Google Data Studio, Tableau, PowerBI, etc) which will give you a good indication of how you fare against the competition.


It’s also important to monitor the rate at which you are comparing links to your competitors.
You can do this automatically in the Authoritas dashboard.
Stage 4 - Build Quality Links
Now that you have identified the gaps between you and your competitors and the velocity at which your competitors are gaining or losing links, all you need to do is build more quality links than your competitors.
How to do exactly this will be the subject of another complete ultimate guide in the series.
Chapter 6 - On-page SEO optimisation for eCommerce sites
In this chapter, we dive a little deeper into on-page optimisation for eCommerce sites. The same principles outlined in Chapters 1 to 5 of course apply, but there’s some additional considerations if you are an SEO in eCommerce looking to grow organic traffic that will convert.
How to do on-page SEO for small-scale/niche eCommerce sites competing with marketplaces?
Marketplaces not only dominate the eCommerce industry, but even the search engine results pages (SERPs). Whenever you search for a product, more often than not the top rankings are dominated by marketplaces’ listings followed by the branded, small-scale and niche sites.
This is one reason why small-scale/niche eCommerce sites first invest in social media marketing, influencer marketing, and paid advertising to grab early success. They believe SEO can either be neglected or postponed as they cannot see results quickly.
But this is not the case. Being a small-scale/niche eCommerce site, here is how you can move forward with SEO.
Why is SEO different for marketplaces & niche eCommerce sites?
Marketplaces
Here are the three major differences between marketplaces vs small-scale/niche eCommerce sites and their SEO practices:
- Product Search – People love marketplaces. Many of your customers will first open Amazon, and then search for a product. 54% of product searches happen on Amazon. While in the case of small-scale/niche eCommerce sites, people either buy from you through other channels or resellers, or search for your brand name in the search engines and then buy from you. These customers could be either repeat buyers or referral buyers.
- Number of sellers and their marketing – The major differences between marketplaces and small-scale sites are the number of sellers and products. They have millions of sellers and billions of product SKUs. Most sellers invest in creating powerful product descriptions, optimising their product detail pages and advertising their products within key marketplaces. So, marketplaces, as well as sellers are investing heavily in SEO. This is not the case with the small-scale sites. Here in many instances there are a limited set of SKUs and limited budgets to spend on SEO.
- SEO team – Marketplaces invest heavily in SEO, and that’s the reason they hire many in-house SEO professionals. A small-sized company does not have the resources to hire many SEOs to manage a site. Sometimes, a consultant with some SEO experience will do. Therefore they need to work smarter with the time they have to optimise their site(s).
How to begin SEO for small-scale/niche eCommerce sites?
Learn the step-by-step SEO process for small-sized eCommerce sites.
Step 1: Audit your competitors and your site too
Use relevant SEO tools to identify where your competitors are performing the best and where there may be gaps, from keywords on page optimisation to backlinks. You can of course do manual checks too. Do a search to see if there are any unexpected competitors that dominate the SERPs for your products. They are the ones you’re going to compete with online.
You can of course do manual checks too. Do a search to see if there are any unexpected competitors that dominate the SERPs for your products. They are the ones you’re going to compete with online.
There are many SEO tools in the market place. The SEO Visibility explorer tool from Authoritas allows you to research up to 20 competing domains at a time across 26 major markets worldwide for free.
Once you audit your site and your competitors’ sites, export the findings in either MS Excel or Google Sheets as they’ll help you create your SEO strategy. For example you can see within Visibility Explorer (below) the number of keywords your competitors are ranking for and how visible they are with the Visibility Index score.

Step 2: Begin with Category Page optimisation
The next step is to optimise your category pages for two main reasons:
- You need to rank for category pages – Your products may go out of stock, affecting the site user experience and rankings.
- Marketplaces rank for category pages – Marketplaces are tough to compete with but are favoured by Google for many queries, so to rank for these terms you need to adopt a similar approach.

While optimising category pages for a small-scale eCommerce site, it is important to consider two things that help category pages rank well:
- Keep the UX design of category pages similar to marketplaces, but don’t forget to consider the expectations users have from niche/small-scale sites. You know your niche better than anyone else and can probably write more expert content than Amazon’s in-house team as they have so many categories to cover.
- Add relevant content that has “transactional intent”, taking into consideration that the buyers’ intent on category pages is usually to evaluate making a purchase, so ensure that your content helps users that are window shopping actually make a purchase. For example, you could use the Authoritas’ Frequently Asked Questions explorer tool to find questions consumers are asking about products and brands on your category page and ensure you answer these questions.

Step 3: Continue with Category and Product Page optimisation
It is still important to optimise product pages for specific product search queries. For example,

Here is the product page of the niche eCommerce site’s listing:

These are some quick SEO optimisation tips to rank category and product pages higher:
A) Finalise your keywords
During the SEO audit, you would have produced a list of keywords that a category page of a marketplace ranks for. Utilise those keywords and even augment the list from Google’s related search queries and Google Search autocomplete.

These are some quick SEO optimisation tips to rank category and product pages higher:
A) Finalise your keywords
Here is how you can pick up the keywords from Google Search Autocomplete. Type a keyword phrase followed by the letter ‘a’ then ‘aa’, then ‘ab’ and cycle through the alphabet. Needless to say there are plenty of SEO tools that will automate this for you.

B) Create customised but better URLs
The URLs of category pages would always be smaller and keyword-based. But, while creating URLs for product pages, you need to be mindful of two things:
- Small-scale sites have limited configured products leading to limited product pages, so customising URLs is not that cumbersome, unlike marketplaces.
- Marketplaces have a feature where URLs are created dynamically, so we can take this up as an opportunity to add the keyword with the highest search volume in our URL to increase the chances for it to rank better and get a better CTR.

C) Add a Canonical Tag
A canonical tag in your code tells search engines to consider the URL specified as the original or master page of all similar or duplicate pages.

This code should be present across all your website pages, including homepage, category, product pages and more. It is the most common way of dealing with the duplicate content issues many eCommerce sites face caused by faceted search and auto-generated SEO friendly landing pages using synonyms, which often create URLs where the word order is changed, so they look different but the products returned are identical.
D) Optimise your title, meta description, H1, and H2 tags
Use the keywords and topics with the highest search volume within your meta title, meta description, H1, and H2 tags. These are still important.

In the example below, use a variety of relevant keywords in all of these tags to gain the maximum benefit.

E) Add detailed product description
Here’s my guide on how to write a persuasive product description in which she shared what you should include in the product description and how you should write it effectively.
Things your product description must have:
- Product features/specifications
- Product benefits
- How-to-use section
- Product care tips
- Company or seller information
- Comparisons
- Warranty, guarantee, and support
- Media graphics (videos, images, etc.)
- Frequently asked questions (FAQs)
F) Add enough FAQs
As mentioned earlier, it is important to have FAQs in product descriptions, so how do you identify which questions to include?
- Research the questions being asked by consumers on competitive marketplaces.
- Crawl Google Search for Instant suggestions, related searches and People Also Ask queries (Authoritas’ FAQ Explorer can automate this for you)
- Look at other Q&A sites or industry forums that rank well on Google
- Research the questions that you receive from your customers either via email or social media.
G) Add strong internal linking
When it comes to creating text-based content to help customers either get the right information or reach the right product, you need to link to your website’s inner pages.
Internal links are under-utilised and are one way to help increase your visibility in the SERPs. Whether you write a blog or a guide, add the right category, product and content links like L’Oréal Paris has done here. Remember NOT to over do the internal linking – don’t link every keyword on every page of your site!

H) Add relevant Schema markup
Structured data helps search engines understand the content and purpose of your category and product pages and enhances the way the listing is displayed by the search engines.
You need to pick up the best ones: Product, offer, ItemAvailability, breadcrumbs, organisation, FAQs, review & ratings.
3 thing to keep in mind while optimising for small-scale/niche eCommerce sites
- Learn from your competitors but have your own strategy.
Your audit will tell you the strength of the competitors’ SEO. Recognise what they are doing and implement relevant insights into your own strategy based on your SKUs, popularity and resources. - SEO is an ongoing process. As we know the industry is constantly changing and with that we need to adapt to what is happening. Review your results, what has worked, what has not? Then make the necessary changes.
- You’re competing with marketplaces that have been doing SEO for years. Be patient, learn from what is working and build on that.
How to do On-Page SEO in the eCommerce sector
When it comes to analysing your eCommerce pages, there are a few checks you can make and questions you can ask in addition to those mentioned at the top of this section.
Firstly, ask yourself if your content is telling a story rather than just trying to sell a product?
Have you explained how your product can engagingly solve the reader’s problems?
Does your content lead the reader to picture how much better their lives will be once they have received and used your product?
Have you ascertained pain points or questions that keep cropping up and answered these?
Are you images fully optimised? And I don’t just mean compressed with appropriate alt text. I’m talking:
- Optimised file names
- Optimised URL slugs
- The best image file selected (and checked that it is compatible with the most commonly used browser)
- Images made responsive
- Image schema markup implemented
- Images added to your image sitemap
Don’t forget that images can rank too, so make sure yours are working hard.
Are all of your product details completed? I don’t think I’ve ever seen a website where every single product page was finished, which is such a missed opportunity. Finally, is it worth transforming your page into a HubPage? Hosting relevant content on your page for users to interact with is an excellent way to continue building relationships, go into more depth with relieving pain points and even continuing relationships post-purchase.
If you’re looking for more help with your eCommerce site, then why not have a look at how our software can fit your needs.
How to do On-Page SEO in Finance
In cases like this, I recommend creating content that targets these users using the terms and phrases they already know. Utilise internal linking to help them navigate to pages that will educate them on the correct terminology (helping them while making yourself look good, knowledgeable and caring), before moving them to a page that uses the proper jargon and gives them the option to convert.
I know this is an eCommerce section, but I’ve included a specific reference to finance sites as in many cases leading sites are looking to ask consumers to make important financial decisions and transactions online.
To a certain degree, it’s still traditional eCommerce but often without the category pages, but in many cases the stakes and amounts purchased are far greater than a traditional ecommerce basket and have more important long-term ramifications for the consumer. For this reason, Google in its Search Quality Guidelines refers to these types of pages as Your Money or Your Life (YMYL) content.
When carrying out on page SEO audits on financial websites, you’ll want to put additional focus on the trust signals, Schema and terminology choices.
You’ll want strong E-A-T signals if you are going to convince an audience to trust you. I would recommend a team page that further highlights the company’s authority in the industry, with a link to this from the page you are reviewing if it’s relevant.
Highlighting awards, membership and positive reviews to reinforce your trustworthiness is essential for websites operating within this sector. So take your time to experiment and find the best place to position these on your page for maximum impact.
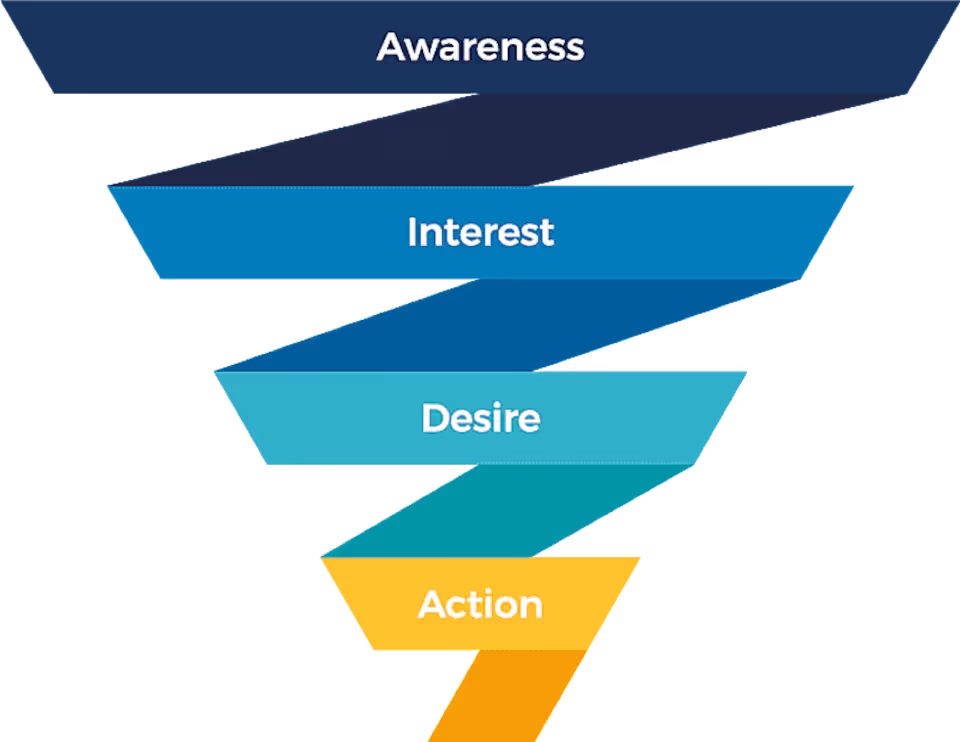
Most financial entities will likely want to refer to the correct terminology, however, for pages targeting users who are still in the awareness or interest phase of the funnel, you could test using terms that they know and understand, even if it is considered slang.
Some of these phrases may even have better search volume than the official terminology!
For example on the Transferswise home page, they promote how many people trust and use their services and that they are FCA regulated.
In cases like this, I recommend creating content that targets these users using the terms and phrases they already know. Utilise internal linking to help them navigate to pages that will educate them on the correct terminology (helping them while making yourself look good, knowledgeable and caring), before moving them to a page that uses the proper jargon and gives them the option to convert.
Chapter 7 - On-page SEO optimisation for local businesses
What is Local Search Engine Optimisation?
When we talk about local SEO, we’re effectively working to get websites to rank in particular locations. These could be bricks and mortar businesses, or companies which visit customers in their own homes. We’re talking about businesses that do not operate nationally (except National brands with local branches) but cover a specific local area. This could be doctors, pizza shops or plumbers.
By targeting local search terms, you make your website much more relevant to the target audience, and it can be much easier to rank for a local phrase, than to target nationally, as the competition is more localised and weaker.
Local SEO has been gaining momentum over the past few years, with more and more searchers targeting more specific, local phrases and ‘near me’ searches.
46% of searches are local according to Hubspot.
Local Searches have a Higher Purchase intent
People who search locally are often further down the sales funnel than those who don’t include a location in their search term. These are people who know what they want and need to find somewhere to buy it.
Google knows this – compare search terms such as ‘yoga’ and ‘yoga + location’. The first one brings up searches and videos about how to do yoga, the second actually brings up classes in that location.
Google is also smart enough to understand implicit user intent and will show you local results for queries such as ‘dry cleaner’ and ‘restaurant’ without you specifying ‘near me’ or adding a locale to your query.
The Local Search Algorithm
On-page local SEO has changed a lot over the past few years. It used to be much more similar to the national algorithm, but now it is a completely separate beast. Local SEO is less about the phrases that you optimise your content for, and more about the signals that your website gives out. The days of hundreds of location landing pages optimised for different locations are over!
The content still needs to be relevant to the locations being searched, but other elements are also important to confirm to Google that your website generates the right local signals:
- Google My Business
- Online PR
- Mentions online and citations in quality local directories
- Local links/events
- Local content
Not to be forgotten is the proximity of the searcher to the business being searched for; this is key for ‘near me’ searches.
Google is trying to identify the sphere of influence of the business, which is why the signals are so important as they can’t be faked quite so easily. Consistency is also key; don’t forget to check name, address and telephone number details on Google My Business and ensure that they match exactly what is found in other places online, such as your website and other directories.
Now for the local SEO tips!
Tip #1: Test and tweak
Like with all aspects of SEO, you need to make sure that you test and tweak to see what works and what doesn’t, so that you can measure success and make changes to further boost ranking. What works in one industry won’t necessarily work in another, and what works in one area, might not work in another.
“What works for a plumber, may not work for a doctor.”
Local on-page SEO is very much an iterative process.
Tip #2: Keyword research for local SEO
Keyword research is vital for local SEO, so that you can identify what people are searching for in your area and how they are describing what you have to offer.
Do people search?
Bicycles Birmingham
Birmingham bicycle shop…?

This allows you to focus your content around the phrases that are getting the most searches.
As well as the main sales phrases, you need to identify the long-tail phrases which talk about your product and service and mention the local area. These local phrases can be used in blogs and longer content and they are great for bringing traffic and boosting relevancy. Brilliant for brand building, these phrases make your website much more findable online for those in the local area.
Tip #3: Relevance is key
Where on-page local search engine optimisation is concerned, relevance is crucial. Title tags and meta descriptions should contain the location keyword. In your longer content, try to mention local landmarks, as these give out signals to Google that reinforce your relevance to that location.
When adding the location to your content and tags, be careful not to over-optimise. Location keywords should be used far more lightly than other keyword phrases as they very easily start to look over-used. Naturally written content is definitely the aim of the game, from both the perspective of Google and the customer.
Tip #4: Make it useful, make it worthwhile!
In order for Google to value a piece of content, particularly something with local intent, it needs to clearly demonstrate its usefulness.
Is it comprehensive and does it cover the whole topic?
Does it answer the questions that people are asking?
Google knows what these questions are and expects you to answer these in the body of the content, so the searcher doesn’t have to go elsewhere to find them.
The content should be fully comprehensive and deliver value to the searcher. Local pages should help those with a local intent, so information such as address, opening times, facilities, telephone number, car parking and nearby landmarks can all help the customer and importantly meet Google’s desire to deliver value to the searcher.

Tip #5: Local Landing Pages to boost location relevancy
Optimise content for local phrases. If you have separate stores, make sure that you have a page on your website optimised for each location. Don’t be tempted to create a whole load of location pages for areas that you have no connection with though, this is where the signals are so important.
The content of local landing pages needs to offer value and be useful, unique and high quality. If it contains local references, case studies, landmarks or testimonials from local businesses, it can boost the relevance and connection of your business to that location.
Finally, don’t forget to test and tweak! Local SEO is not one-size fits all, and the right tactics need to be employed for your location and industry.
Chapter 8 - Useful SEO Tools for page level optimisation
As you probably know, Authoritas is a comprehensive cloud-based SaaS platform for SEO and content marketing professionals and as such we have many of our own SEO tools that cover all the essential optimisation areas an SEO needs to consider.
However, we also recognise that as SEOs we use many great tools to help us excel in our day-to-day roles and here we’ve included some of the favourite tools that we use or our expert co-author use to help with different aspects of on-page optimisation.
Some are free, some are paid. We also invite you to share in the comments below any we may have missed and what you particularly like about a particular tool.
The 4 types of Search Intent
SEO Tools for User Intent
Authoritas SERPs API and SEO platform
Content Tools for assessing Page Quality
Tools for assessing the content on the page and where it needs to be optimised is:
- SEMRush
- ContentKing
User Experience Testing Tools
Google’s free mobile friendly test – https://search.google.com/test/mobile-friendly
Smart Bear – Cross platform browser testing – https://smartbear.com/
Page Experience Testing Tools
Google’s Lighthouse tools – https://web.dev/measure/
Google Page Speed Insights – https://developers.google.com/speed/pagespeed/insights
GT Metrix – https://gtmetrix.com/
Image Compression Tools
Imgix – they have a nice free tool to test the impact images have on your page
Cloudinary – Combining image compression and CDN
Content Delivery Networks
Tip# – Use CDNs that blogs extensively about page speed. They demonstrate that they care about solving the issues we all face to make legacy websites faster and faster.
Cloudflare – CDN and DDOS protection
Kinsta – they have some great articles on how to speed up your WordPress website.
Website Crawling & Internal Link Analysis
Authoritas’ Site Crawling module
External Link Profile Analysis
Majestic
Ahrefs
Moz
Google Search Console
Authoritas’ Backlink profiling module
Chapter 9 - Summary of Page-level Ranking Factors
Thank you to our co-authors for sharing their tips with us as part of our Tea Time SEO Series. On-Page Optimisation is important in all industries but it is how it is executed that is different.
Local SEO in particular, one should remember it is not one size fits all. Local SEO should be part of everyone’s SEO strategy even if one does not have an off site business. Keyword research, internal linking, schema mark up and good content are all important and should not be underestimated.
SEO is one industry where there are constant changes, but content has always been at the forefront especially fresh content. In today’s environment where off site stores and restaurants may be closed at any moment, more of us need to be online. It is important more than ever that your On-page SEO is meeting the needs of your users.


Other Ultimate Guides
A Practical SEO Guide to eCommerce SEO
If you would like to drive more buyers to your eCommerce site, then you need to learn the most successful techniques for growing relevant traffic to your site using a combination of SEO techniques and tactics. In this actionable guide to eCommerce SEO, we cover some of the unique characteristics of optimising for online stores that differ from non-transactional sites.
A Practical SEO Guide to Backlinks and Link Building
Everyone says 'Content is King' but links have always been a critical part of Google's ranking algorithm and are likely to remain as important in the future. So, dive in and pick up some great backlink analysis and link building techniques.
A Practical SEO Guide to Keyword Research
Keyword research is a foundational and essential part of any SEO strategy. In this extensive guide, the authors take you through the keyword and audience research process, data collection techniques, competitive gap analysis and how to interpret user intent and make decisions around page mapping to keyword groups. Use this guide to develop a systematic approach to keyword research that allows you to set your SEO efforts in the right direction.
A Practical SEO Guide to SEO Reporting
Whether you are part of an enterprise in-house SEO team or SEO agency team it is more likely than not that you will have to ‘report’ on and share your SEO progress and activities with management, colleagues or clients. This guide discusses the type of metrics to report and then different ways of producing high quality insightful SEO reports.
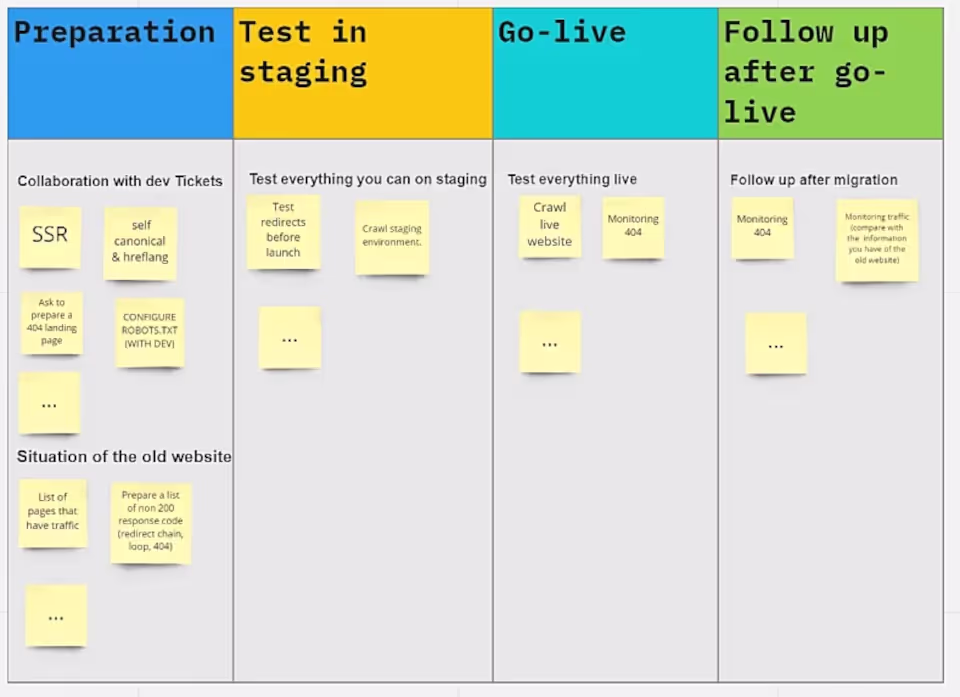
A Practical SEO to Website Migrations
Probably one of the most stressful and time-consuming tasks that we all have to face at one stage in our career is to manage a website migration project. Whether this is due to re-branding, an acquisition or merger, a change of domain name or a change of technology platform, there is an awful lot that can (and often does) go wrong. In this guide, three SEOs with extensive experience of website migrations cover the essential steps in planning and executing the site build before and post-launch.
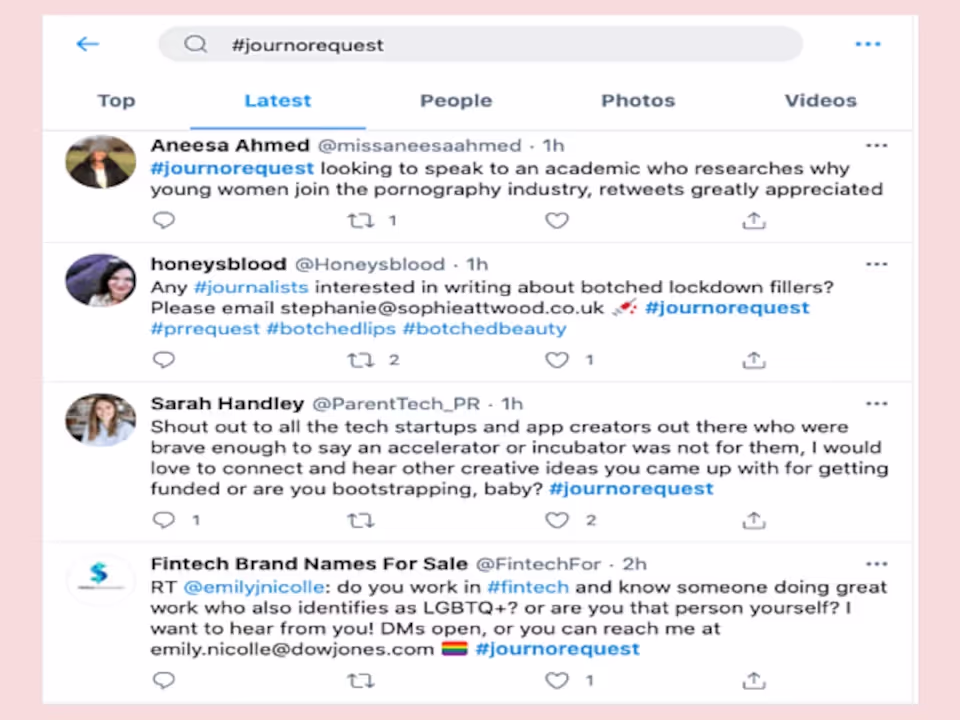
A Practical SEO Guide to Digital PR
Learn how you can use the latest digital PR techniques to increase the exposure of your brand by gaining online coverage on well known sites, social media platforms and generating high quality links and referral traffic. This practical step-by-step guide gives you the essential information you need to start this process yourself or at the very least brief a digital PR agency.
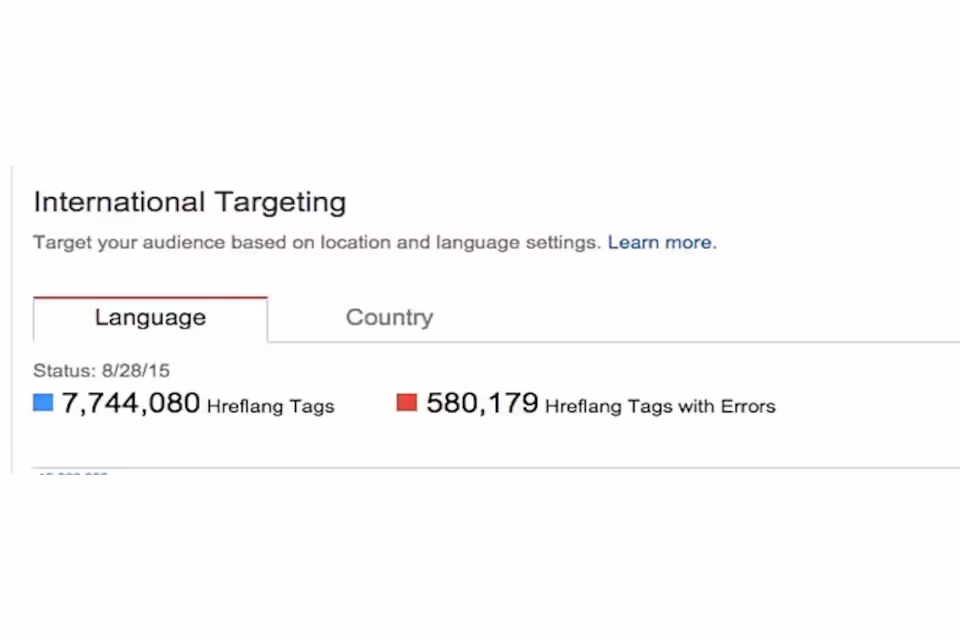
A Practical SEO Guide to International SEO
In this in-depth gudie to international SEO, our expert SEOs take you through the key differences and scenarios you will encounter when optimising a single mulitlingual site or multiple sites in different countries. It covers practical tips and advice and lessons from the trenches about Local SEO vs International SEO, Market Entry strategies and common pitfalls and how to mitigate (if not avoid) them.
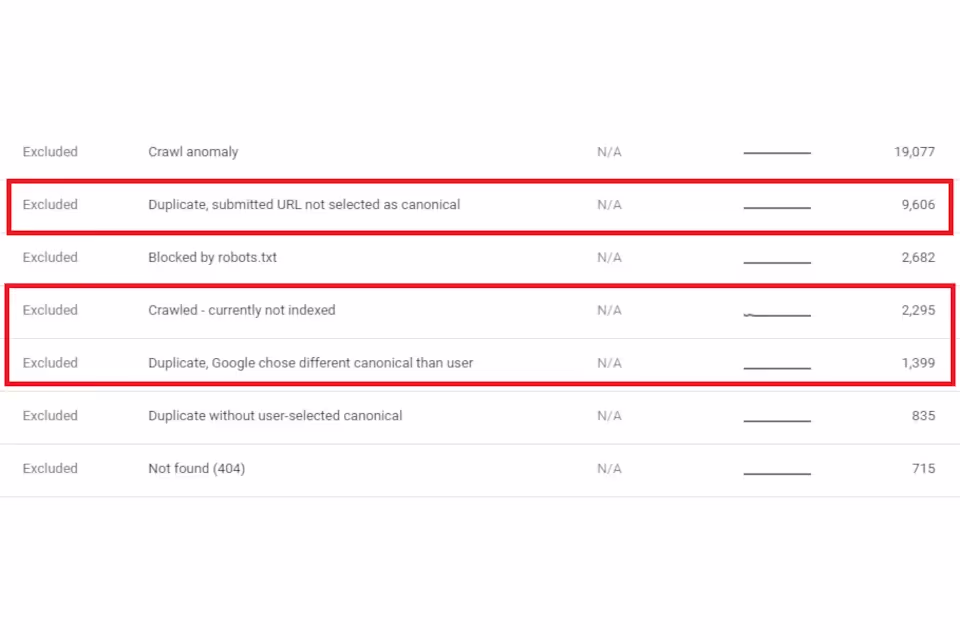
A Practical SEO Guide to Technical SEO
Technical SEO is the foundation on which successful SEO campaigns are built. If you're not a web designer or developer then this guide to technical SEO is for you. You can learn the key technical issues that expert SEOs look to resolve to prevent issues for users and search engines.
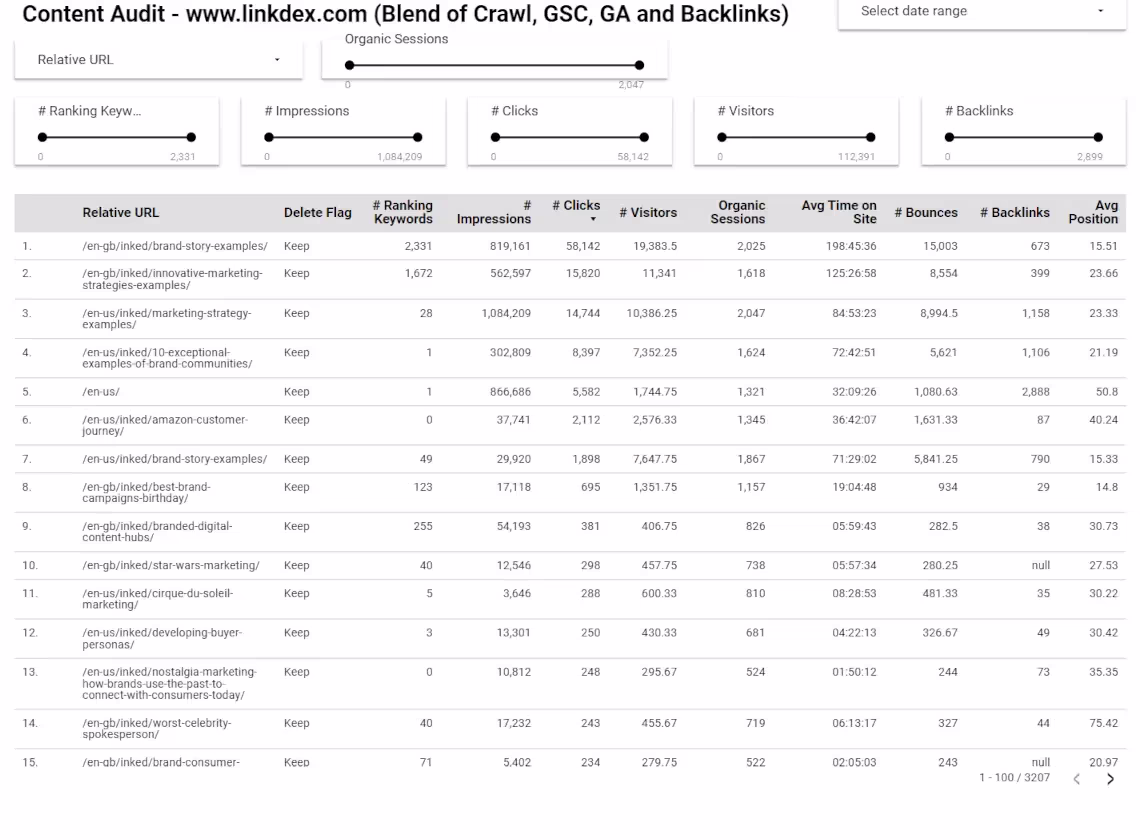
A Practical SEO Guide to Content Auditing
Want to know how to conduct an SEO content audit on your website? Our guide, carefully put together by three great SEOs covers everything you need to know to get started. From properly understanding the performance and the potential of your pages, to evaluating user intent to see how well your existing content matches the type of content Google prefers. Authoritas can now even automate the data collection and presentation of the data needed to perform a content audit.
A Practical SEO Guide to User Intent
The whole SEO industry has been debating how best to understand what the searcher's intent is for the past few years. In this guide, we look at answering practical questions around user intent, what it is, how to analyse it and what to do with your findings.
A Practical SEO to On-Page SEO
This guide goes into detail about how to improve your On-Page SEO strategy with a set of actionable topics and tasks for you to consider when optimising your pages for users and search engines.
A Practical SEO Guide to Competitor Auditing
This guide helps you take a systematic look at all the key elements of competitive analysis for SEO. It covers, how to define your market, how to analyse your competitors' performance, competitive gap analysis, SWOT analysis, SERP analysis and how to set goals for your SEO project.
A Practical SEO to Content Strategy
Setting a sound plan for your content marketing efforts is the key to success. In this guide to SEO content strategy, three experienced SEOs share their advice on content strategy for Local SEO, how to create content strategies for eCommerce sites and what your content strategy should look like for your blog.